From Technical Infrastructure Monitoring to Functional Business Monitoring
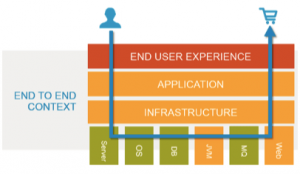
Traditionally, Business Function Monitoring is done in Operations and most likely on an infrastructure level. The technician (operations) view and the end-user (business) view on monitoring are different. The technician resolves issues by identifying technical components involved and their dependencies on each other. However, monitoring must support the business and ensure that end users can do their work, for example by keeping websites available and performant. Monitoring looks from a business perspective, in an end-to-end context, and supports the end user experience:
- Availability: is it actually there?
- Functionality: does it work and functions like it is supposed to?
- Performance: does it perform fast enough and what’s the time to market?
- Quality: does it work well enough or even excellent?
- Context: are all requirements fulfilled to stay in business and create new business?
- Credibility: is it trustworthy, safe, private, and secure?

Integration of monitoring levels
The challenge for the Business is to integrate the different levels of monitoring. With this infrastructure, networks, services, applications, transactions, business processes and more, are visualized into one relatively simple functional business overview. The monitoring sites (interactive tools, – dashboards, etc.) can be made available for (end) users. Integration of all forms of monitoring into a unified view will also identify the blind spots in the end-to-end process, because of internal and external dependencies and organizational boundaries. In order to provide an integrated end-to-end functional business view, monitoring data about the state of the business processes, applications, middleware and infrastructure needs to be continuously collected, stored, and visualized.
“Monitoring data about the state of the business processes, applications, middleware and infrastructure needs to be continuously collected, stored, and visualized.”
This Monitoring Integration requires strong coordination and cooperation. For example, what are the escalation procedures? How do we share knowledge? Or, who takes up the overall responsibility? What actions are taken and based on what? In the end, MDD is a conceptual change that requires a new way of thinking. It’s more about people and processes than technique. Only with this cultural change will you harvest the advantage of MDD, which is faster and brings better feedback, which leads to preventive and even predictive actions. The early feedback makes it easier to troubleshoot and ensures effective and anticipating action before issues potentially get into production where they are more expensive to fix.
“The early feedback makes it easier to troubleshoot.”
Where do I start?
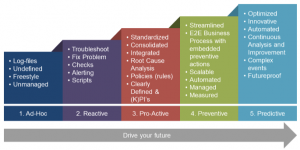
Where you start, depends on your Monitoring Maturity Level. The following maturity model and questions may help you to get a basic understanding on where you stand today.
In order to grow in Monitoring Maturity, you can take steps (one step at a time) as mentioned in the image above. The most common development I have experienced at customers is the step from maturity level 2 to 3, in which your business evolves from re-active to pro-active.
The following questions may also be of help to determine where you stand and where to start.
- Do you understand what you want or need to monitor and what you are actually monitoring right now?
- Do you understand normal behavior and (un-)acceptable deviations?
- Are you and your organization prepared for action and ready to learn?
- Is it easy to monitor and maintain the monitoring solution (out of the box)?
- Are (overall) responsibilities and escalation procedures clear?
- How do you share knowledge? What actions are taken and based on what?
- Inflight (real-time) monitoring or ad-hoc, intermediate state or database state?
- Automated or manual monitoring (alerting and actions)?
- Which monitoring tools do you have and does this match with your monitoring needs?
What are the benefits?
Operational expenditures are reduced by improved staff allocation, decreased downtime, and a reduction in business process disruption. The cost of ensuring peak-performance of business applications reduces. It provides businesses with 360-degree situational awareness of operational and transactional data across applications, transactions and messaging middleware. This ensures optimum service levels while also eliminating the hidden costs in business processes.
“This ensures optimum service levels while also eliminating the hidden costs in business processes.”
Correlation of transactional and operational data in a unified business context, enables you to identify and fix problems – even predict and prevent them – before they compromise SLA or other performance standards/norms in production. (Key) Performance Indicators can be visualized (near) real-time in interactive and dynamic Dashboards. With the help of the end-to-end monitoring events, you are able to do complex event processing (CEP). With CEP you smartly combine different events (from different applications and or processes) to be more innovative in your line of business. – Innovations that will excite your customers!
Other relevant DevOps content
- BLOG: Red Hat – OpenShift Day-2 Ops from the trenches
- REPORT: 2018 State of DevOps Report – DevOps Research Assessment
- OFFER: DORA – DevOps Research and Assessment
- BLOG: Observability in OpenShift with Prometheus
- WHITE PAPER: The Digital‐Native Enterprise – The Red Hat and Devoteam Success Formula
- BLOG: Shared continuous delivery toolchain, the silver bullet?
- NEWS: Atlassian Gold Solution Partnership for Devoteam
- INFO: Our CALMS approach towards DevOps
- CASE STUDY: Improving the CIO delivery cycle at Liberty Global
- BLOG: Monitoring to reduce Mean Time To Recovery (MTTR)
- EBOOK: API Strategy and Architecture
- EBOOK: DevOps Perspectives
- OFFER: DevOps and Culture
- OFFER: Continuous Delivery
- CASE STUDY: Same meat, different gravy
- BLOG: Become a high performing organization with DevOps as business enabler
