
With the move to cloud-native application patterns it has become possible to build scalable and resilient systems that live up to modern demands. We have seen however that with this great change comes, greater complexity. Enterprise-grade platforms like Red Hat OpenShift come to the rescue, shielding away from the developer much of the complexity of underlying infrastructure.
However, there still remains the question of monitoring the several hundred microservices, as well as the platform that runs them. With many moving parts comes a vital necessity, one that has recently gained much popularity in cloud-native parlance – “Observability”. In this blog we look into how we can leverage observability in Red Hat’s OpenShift Container platform.
The case for Observability
But first, what does Observability mean? People often use the terms Observability and Monitoring interchangeably. My plan is not to go into the semantics here. Distributed systems expert Cindy Sridharan discusses the topic in her seminal blog post “Monitoring in the Time of Cloud Native”. To me, Observability in simple terms, is the attribute of a system that exposes data about itself that one can easily access. It is the ability to know what is going on, but also why. An “observable” system is one that opens up its vital statistics for easy whitebox monitoring.
“The more visibility you give to people, the less access you need to give them to the infrastructure.” – says Kubernetes guru Kelsey Hightower at the KubeCon in Austin, December 2017. For operations folk, this means a way to both securely monitor the platform and diagnose issues without having to SSH into a machine. As for a developer, this is the ability to easily trace and correlate request flows between hundreds of services.
Prometheus for OpenShift: a great fit
Observability is usually grouped in 3 so-called pillars: logging, metrics and tracing. Here we focus on metrics, in particular how we can examine metrics from an OpenShift cluster by leveraging the latest version of Prometheus. Metrics are basically numbers of vital statistics that are aggregated over time. OpenShift inherits the observability built into Kubernetes, and therefore metrics about CPU, memory, network, etc are exposed by the kubelet which are made available by Heapster. OpenShift uses Hawkular as its integrated metrics engine to gather and expose metrics from running pods. With version 3.7 of OpenShift, Prometheus has been added as an experimental feature, and is slated to replace Hawkular as the default metrics engine in a few releases.
Prometheus is a metrics monitoring system that is built with a cloud-native approach to monitor services. It is also a time-series database, a query language (PromQL) to query the time-series, and a dashboard. The modus operandi of Prometheus is “scraping targets”, or in other words, pull metric information from configured sources. It does this at regular intervals, which is again, configurable, and stores these metrics as a time-series in its database. The Prometheus community has put together a great documentation with concise instructions and best practices.
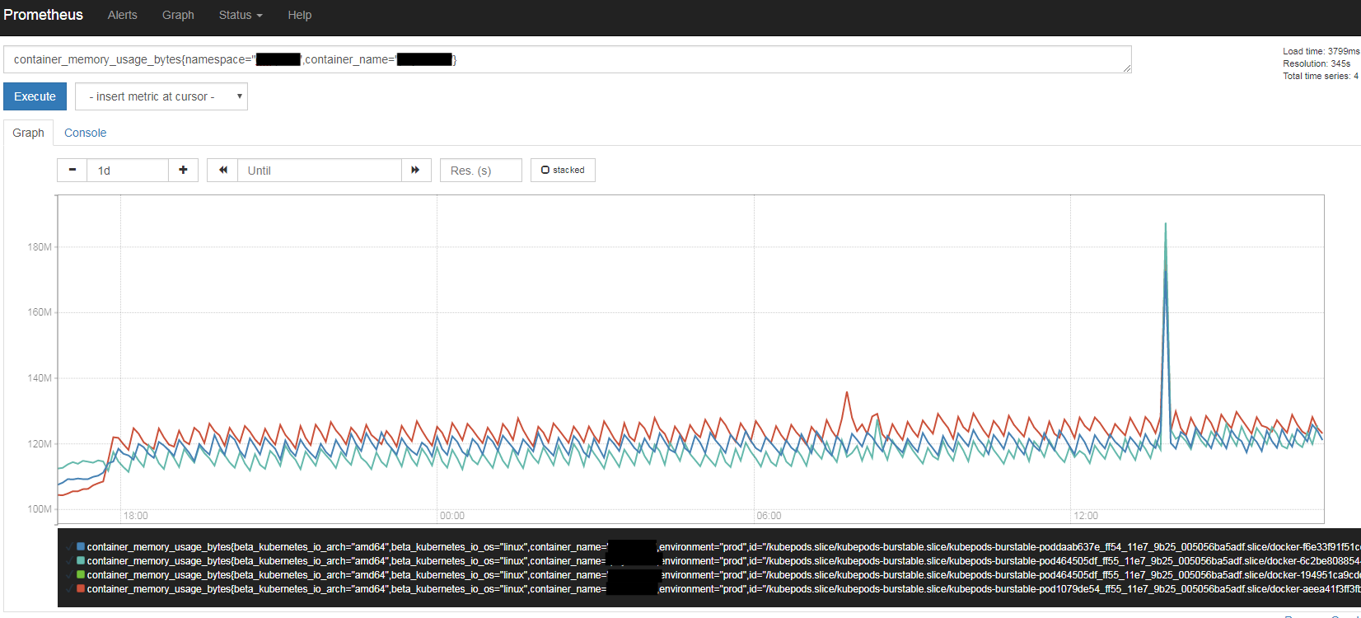
Figure: Prometheus query browser screenshot
Although Prometheus has been around for a while, with the recent release of its version 2.0 is witnessing a big spurt in adoption. This has among other factors to do with significant improvements in how Prometheus handles storage. Prometheus was also the second open-source project to be adopted by the Cloud-Native Computing Foundation (CNCF) after Kubernetes, and in all sense is a perfect fit for monitoring OpenShift.
Plugging in Prometheus and other components
There are several ways to install Prometheus in OpenShift (a neat example here), but importantly the right ports on the cluster nodes must be opened to let the Prometheus pod connect. Once deployed, Prometheus can gather and store metrics exposed by the kubelets. Of course, you can configure more targets (like routers, underlying nodes, etc) and it will scrape metrics from them too. The scrape configuration is loaded into the Prometheus pod as ConfigMaps. All the gathered metrics are stored in a time-series database locally on the node where the pod runs (in the default setup).
In order to gather statistics from within your own application, you can make use of the client libraries that are listed in the Prometheus website. You can use them to instrument Prometheus metrics and expose them from within your application, usually via a /metrics endpoint. For operators, it is handy to have more information about underlying nodes than that exposed by the kubelets. For this you can make use of node-exporter, with which you can collect hardware and OS metrics. A whole lot more of exporters for different metric sources are listed on the Prometheus website.
While one can gather and store metrics using Prometheus, we also need to setup alerting and dashboarding for good old cluster-ops. We can set up alerting via Alertmanager which we can use to trigger alerts to external alerting systems, email, slack, pagerduty, etc. As for dashboarding, Prometheus itself comes with a simple query and graphing feature, but it is common to integrate a full-fledged dashboard tool such as Grafana.
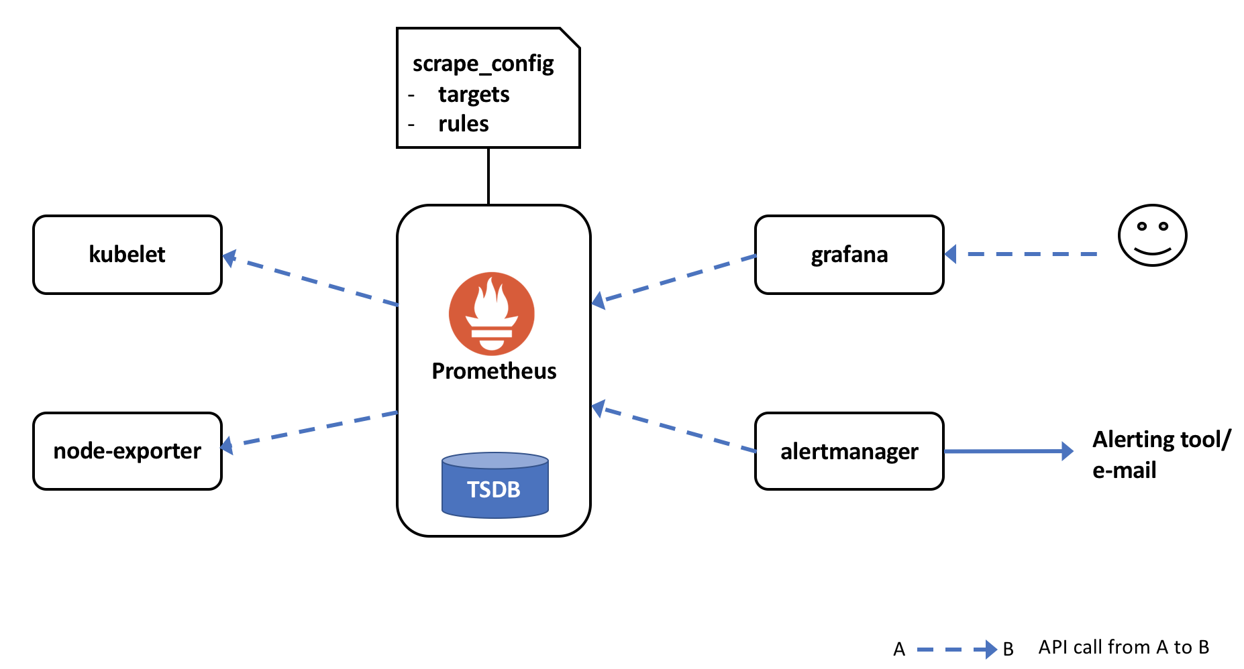
Figure: Example topology with Prometheus, alertmanager, node-exporter and grafana in OpenShift
One caveat to bear in mind is that Prometheus is not built for long term storage, so if we want to collect long-term statistics we should use adapters to send the metrics to external databases like InfluxDB. It is hoped that long term storage capability will be provided built-in with OpenShift when it’s Prometheus integration reaches full feature status.
Get some actionable information
Armed with the necessary monitoring tools, we now arrive at the topic of “what” to monitor. For applications, the most interesting metrics to get started would be number of requests, response times, error rates, etc, next to specific cases needing investigation. For operations, it’s the possibility to monitor cpu, memory, latency, and just about everything the kubelet and other exporters can provide, over individual containers to cluster-wide scopes. Resource utilization information is useful to manage and determine quotas and cluster expansion decisions. One cool thing with prometheus is that we can use OpenShift selectors as filters while querying the time series. The Prometheus query browser is your friend, and as obvious the possibilities are endless. Alerting can be setup on the collected metrics to aid proactive problem detection. The observability achieved should help not only to track back to what happened in the past, but also to improve future performance.
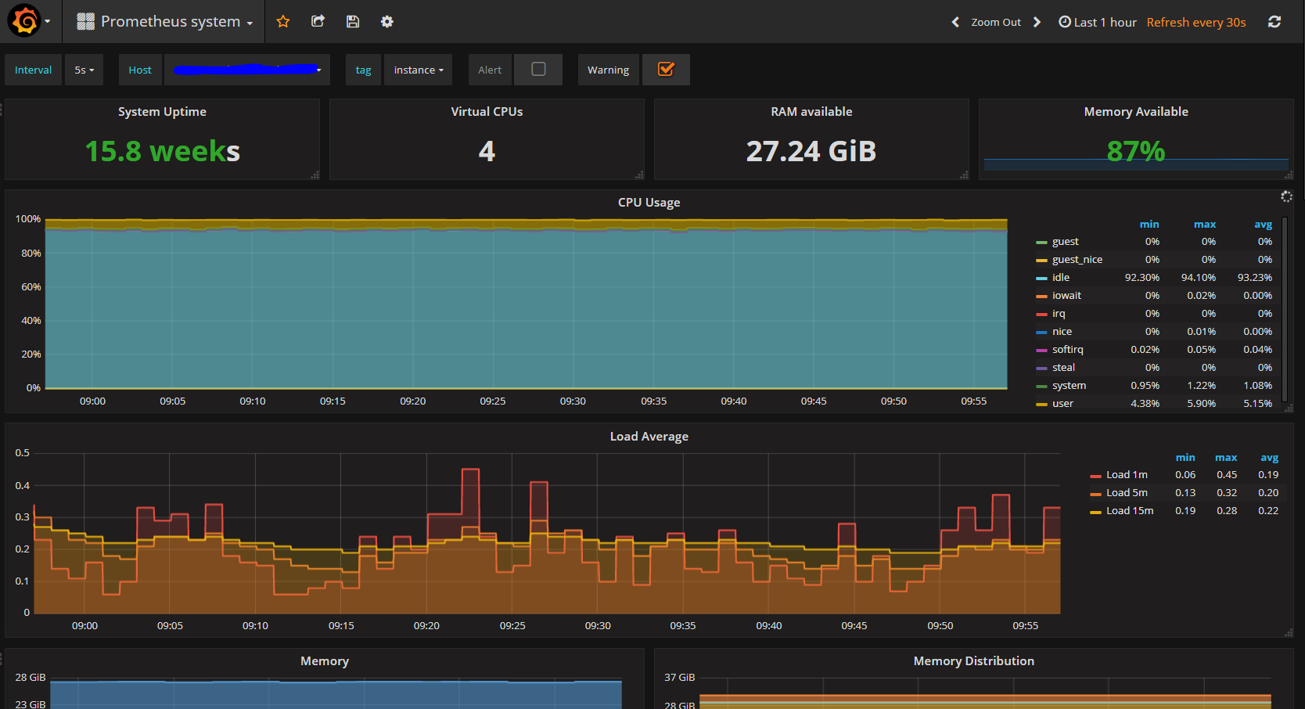
Figure: A grafana dashboard based on Prometheus metrics collected from node-exporter
As mentioned before, Red Hat is clearly moving towards a Prometheus based metrics engine for future versions of OpenShift, which is indeed a good sign. OpenShift already has a good logging infrastructure with its integrated EFK (Elasticsearch-Fluentd-Kibana) stack. Red Hat also has plans to incorporate tracing and service mesh solutions into the OpenShift platform, thus promising Observability across all the three pillars.
More information about Observability?
For questions about this blog you are able to contact Gopal Ramachandran, DevOps Consultant at Devoteam Netherlands (gopal.ramachandran@devoteam.com). More about this subject? Visit our Observability page.

