This blog will explain how activities within Business Processes can be visualized ‘real-time’ using a visualization tool of your choice on top of event data being gathered by a professional business process monitoring tool. This setup allows the business to inform and be informed about their processes at any time. Fast data becomes more and more crucial and with this “monitoring & visualization” approach you have the possibility to steer on Key Performance Indicators (KPI’s), analyze trends and forecast the workload, and pinpoint any issue based on real time events within the complete end-to-end process flow. Even better you can prevent issues from happening by taking actions automatically based on certain conditions and Service Level Agreements (SLA’s).
Public Lighting Process used as an example
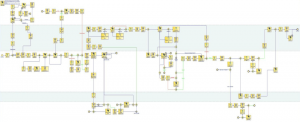
Use case is the Public Lighting Process. When a local government wants to (re)place or (re)move public lighting (lampposts, etc.) the Electricity Grid Operator (or one of their contractors) takes care of the necessary changes in the underground infrastructure. The process starts whenever they use the Public Lighting portal to: do a connection request (new, replacement, removal), report failures, and/or follow the status. Simplified the Public Lighting Process looks like this:
This complex workflow has been implemented by the Grid Operator in a Business Process Management (BPM) tool called iProcess.
What we did and how we did it …
The goals of this Proof of Concept (PoC) executed by us were as follows:
- Monitoring (collection and correlation of events) on Tibco BW Integration layer and iProcess
- BAM Dashboard on top of the collected and correlated monitoring events
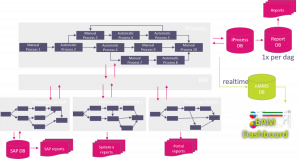
The following picture gives an overview of how live events from both iProcess and BW are directly gathered and stored in the nJams Database. As a matter of speech you could say that nJams is sitting in the same room with BW and iProcess and listening, watching and recording everything that’s going on. The visualization tool represents this event data in for the Business meaningful BAM Dashboards.
Ad 1. Monitoring (collection and correlation of events) on Tibco BW Integration layer and iProcess
For the Monitoring part we used the tool nJams (product of Integration Matters) because it provided out of the box visibility on the integration layer (Tibco BW client). The nJams Software Developer Kit (SDK) made it also possible to develop a nJams client for iProcess within a short timeframe (couple of weeks).
Correlation of workflow and pinpointing of the issue in Tibco BW Integration Layer (details like input/output/error message on drilldown)
Follow the complete workflow and determine the process status in iProcess
The following example gives an idea of how easy a nJams client (in this case for Tibco BW) can be implemented. The nJams BW client has been installed on the Tibco BW servers and configured in the Tibco Runtime Agent (TRA). Technically speaking the installation is a matter of placing the njams.jar file in the following path: <TIBCO_HOME>bw<version>libpalettes, add some nJams configuration lines to the BWENGINE.TRA and BWENGINE.TEMPLATE file located in <TIBCO_HOME>bw<version>bin, and restart the engines.
Ad 2. BAM Dashboard on top of the collected and correlated monitoring events
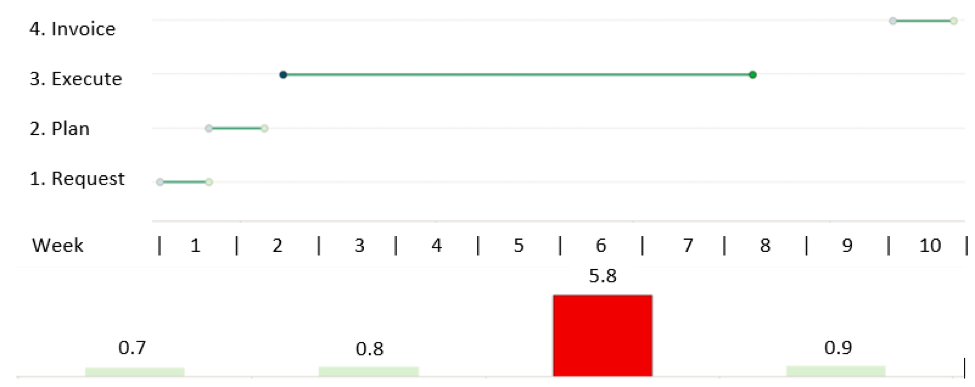
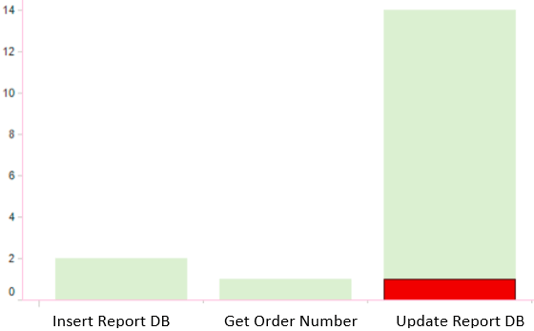
For the BAM part we use Tibco Spotfire in order to rapidly (couple of days) create some advanced dashboards on top of the monitoring event data gathered by nJams. The following pictures are visualization examples of a. Workflow, b. Workload, and c. Status.

a. Workflow Timelines of manual steps (Request, Plan, Execute, and Invoice) and Bar chart of elapsed time (=KPI) per manual step (red means that the max. elapsed time (SLA) for the execution step has been violated (KPI transparency).

b. Number of requests (workload) in a certain timeframe (forecasting possibility)
c. Number of calls and status (success or error) in three automated steps (Red means error and will show details like Case ID, Owner, etc. on drill down)
What’s in it for you?
Based on history and current experience the business case for this solution was, is, and will be very clear:
- ‘Non-Intrusive’:
– quick visibility, no business and/or performance impact - Business Process Root-cause analysis:
– Reduction of Time to Develop, Test, and Troubleshoot. Development & Test > 15% each! Quality with 35% improved
– Pinpoint the issue fast and precise
– End to End Correlation between applications - Real-time visibility in Business Processes (workflow, workload, status):
– Real-time visibility to provide clear insight for – , and communication Between Business & IT - KPI Transparency and Forecasting Possibility: Steering based on KPI’s, SLA’s and trends.
Other relevant DevOps content
- BLOG: Red Hat – OpenShift Day-2 Ops from the trenches
- REPORT: 2018 State of DevOps Report – DevOps Research Assessment
- OFFER: DORA – DevOps Research and Assessment
- BLOG: Observability in OpenShift with Prometheus
- WHITE PAPER: The Digital‐Native Enterprise – The Red Hat and Devoteam Success Formula
- BLOG: Shared continuous delivery toolchain, the silver bullet?
- NEWS: Atlassian Gold Solution Partnership for Devoteam
- INFO: Our CALMS approach towards DevOps
- CASE STUDY: Improving the CIO delivery cycle at Liberty Global
- BLOG: Monitoring to reduce Mean Time To Recovery (MTTR)
- EBOOK: API Strategy and Architecture
- EBOOK: DevOps Perspectives
- OFFER: DevOps and Culture
- OFFER: Continuous Delivery
- CASE STUDY: Same meat, different gravy
- BLOG: Become a high performing organization with DevOps as business enabler


