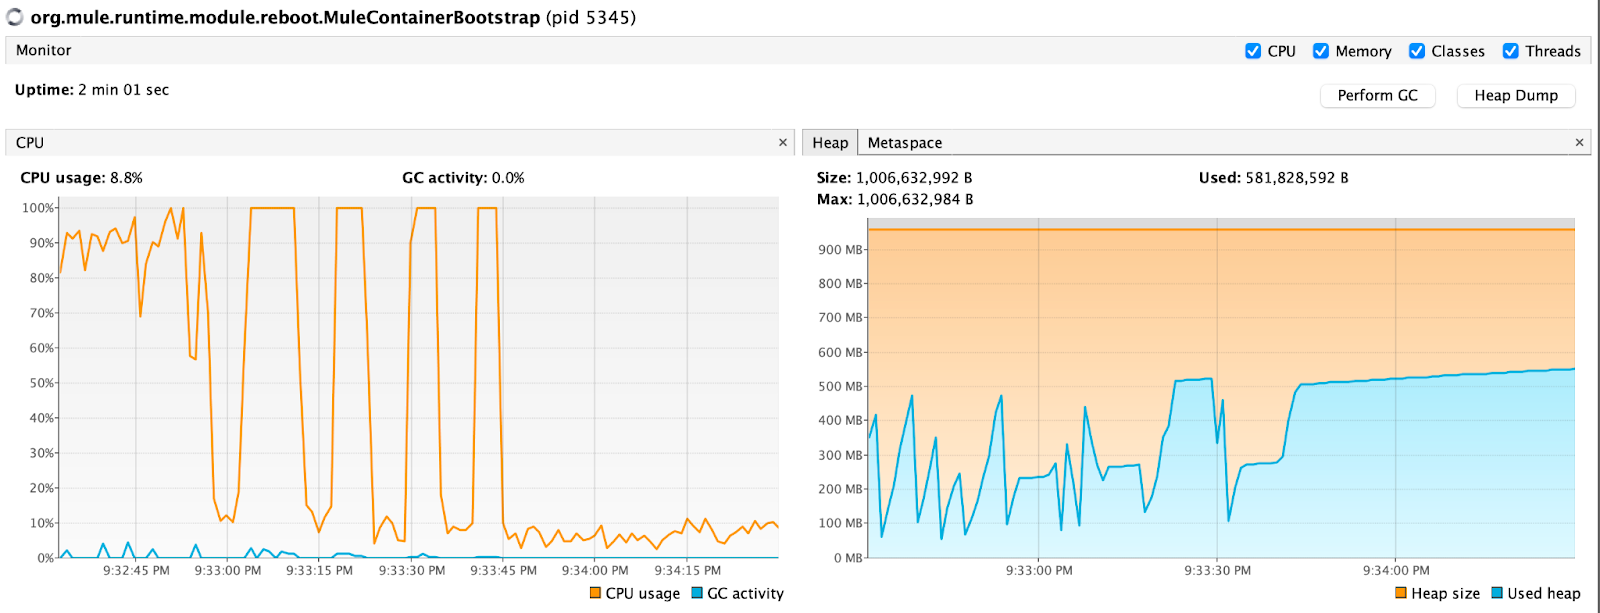
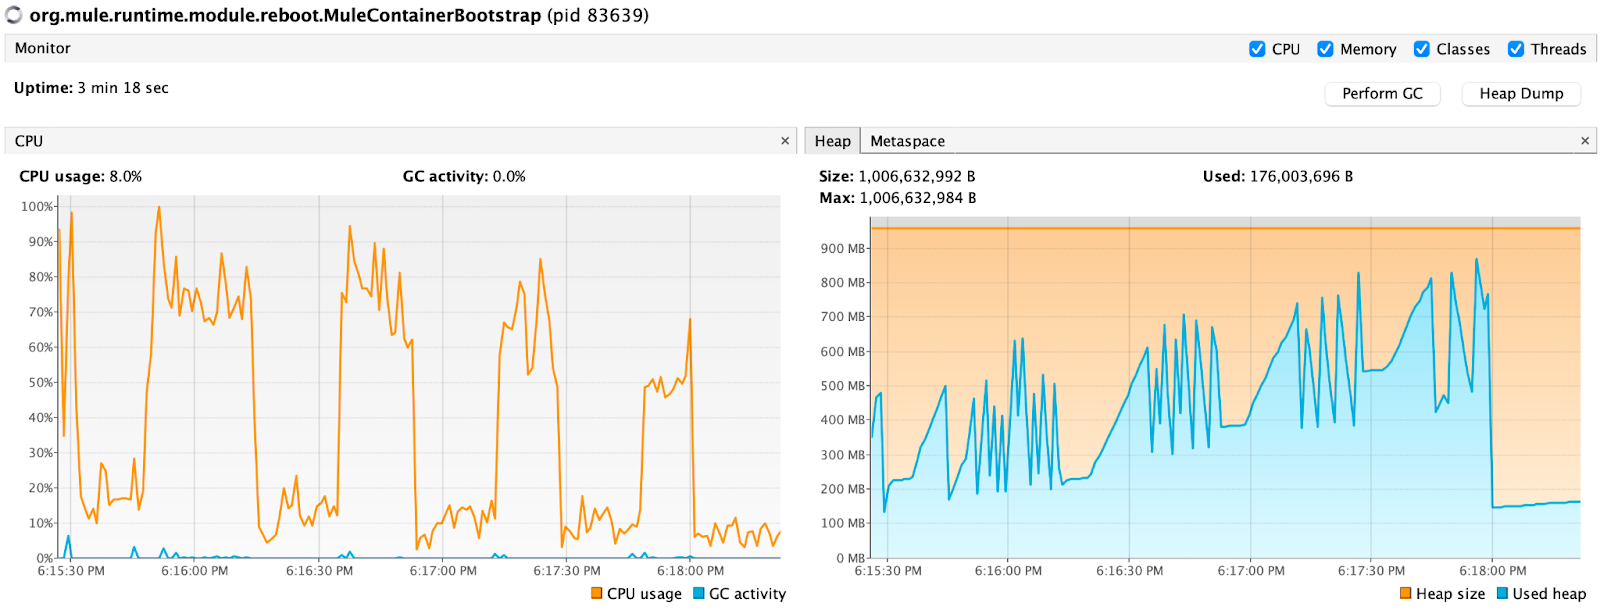
Since we decided to go with Kafka, we can at least increase the initial query number because our service (experience) application now can consume it at its own pace. So I increased the take amount for every API call from 100 to 1000. Good news is memory consumption doesn’t seem to be affected at all during the process and I was able to process 15319 events to Kafka in 2 minutes 18 seconds.
We still have room for memory and I increased it to 4000 invoices per API call and memory seems still okay, it took 1 minute 38 seconds for 15319 events to be processed, so even better. But from here 3rd party API starts to struggle and gives out HTTP 500 errors.
CPU patterns are slightly different but that is expected since smaller but more frequent payloads cause this. But why does the memory seem not impacted at all? I believe it is because I am using HTTP Request in Streaming Response mode. You can observe from the graph below how the memory consumption is changing when I turn the Streaming Response off. It peaks to 913 MB which is almost all our memory for 0.2 vCore test. So it is a better idea to use Streaming Response in the HTTP Request component of Mule.
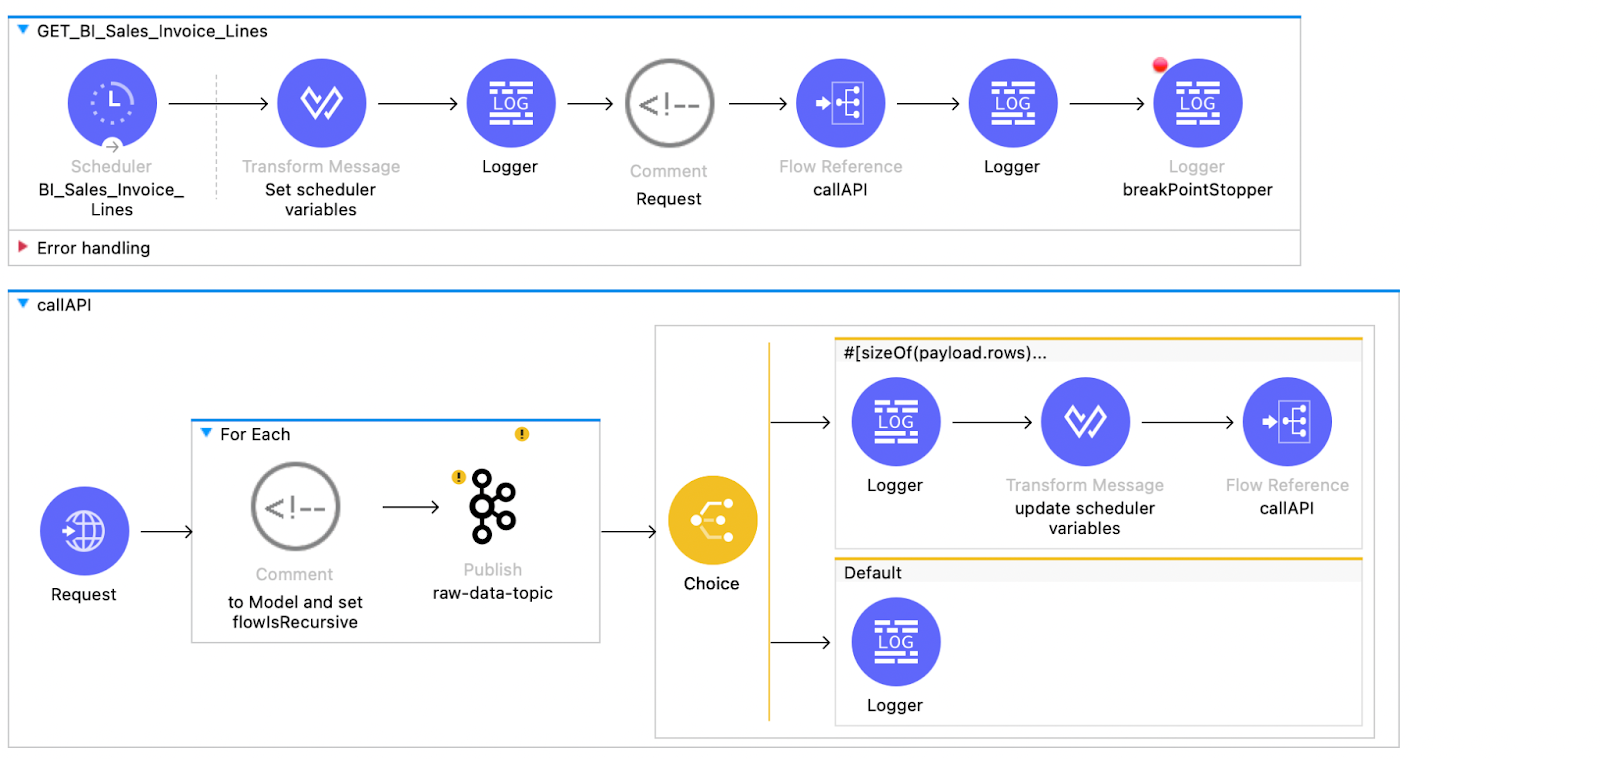
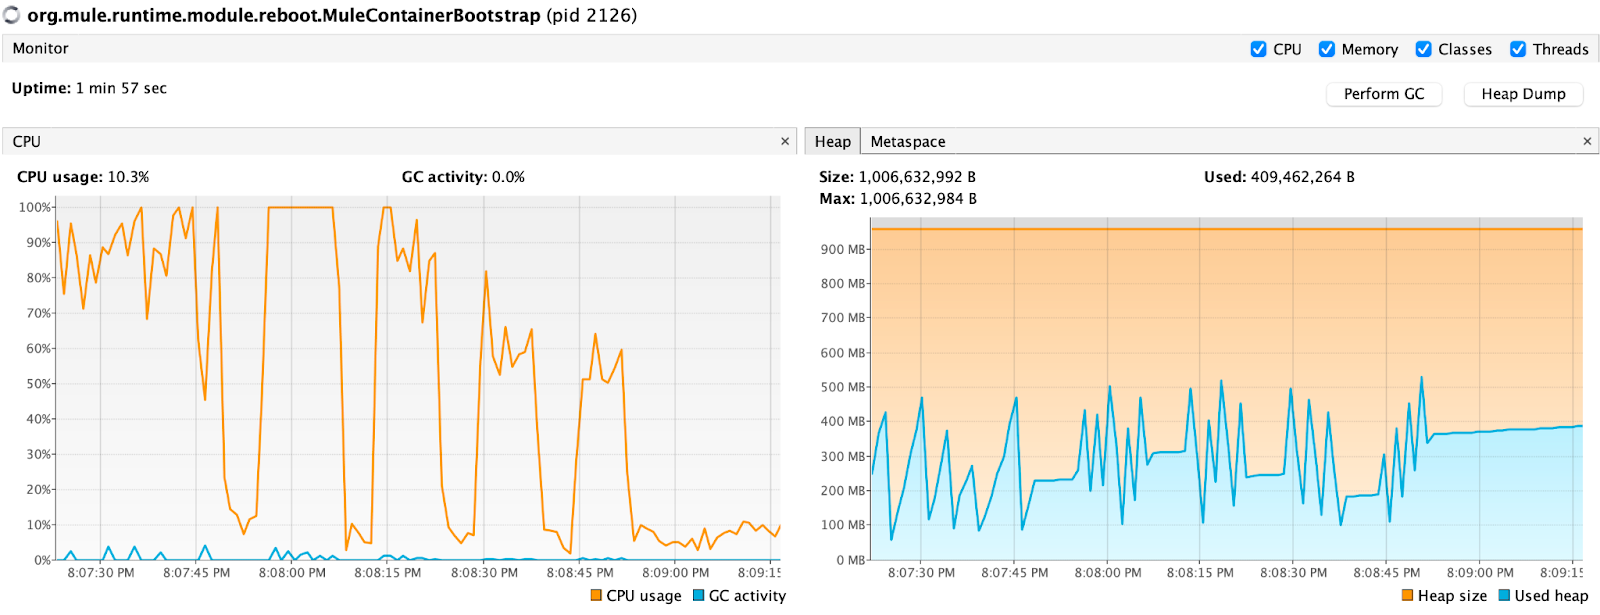
So now our application is now calling for the invoices, mapping them right away and putting them to Kafka as events one by one. With our final approach we have managed to complete this in 1 minute 38 seconds. From here our prc-layer application can consume from the kafka topic, enrich it if necessary and deliver it to the respective sys-layer application. But transforming the data right away may not be the best solution. Kafka can persist the data as much as you want ( as long as you provide the space) and you can go back in time and reuse what you queried before. So having the raw data at hand in your domain seems fair. Let’s see how the performance is affected with this design change (transform component is commented out).
Loading the data directly to Kafka with HTTP streaming response took 1 minute and 6 seconds. So not having the transform saved another %30 time saving but we still need that transformation nonetheless. I also tested this with Kafka Connector’s Partitioning Strategy for both DEFAULT (always to the same partition) and ROUND_ROBIN. It did not affect the time, I thought maybe the 3rd party API we are calling caused a bottleneck but when I doubled the invoice per call (8000) the total time did not change. So having more than 1 partition does not help on the Write performance in this case.
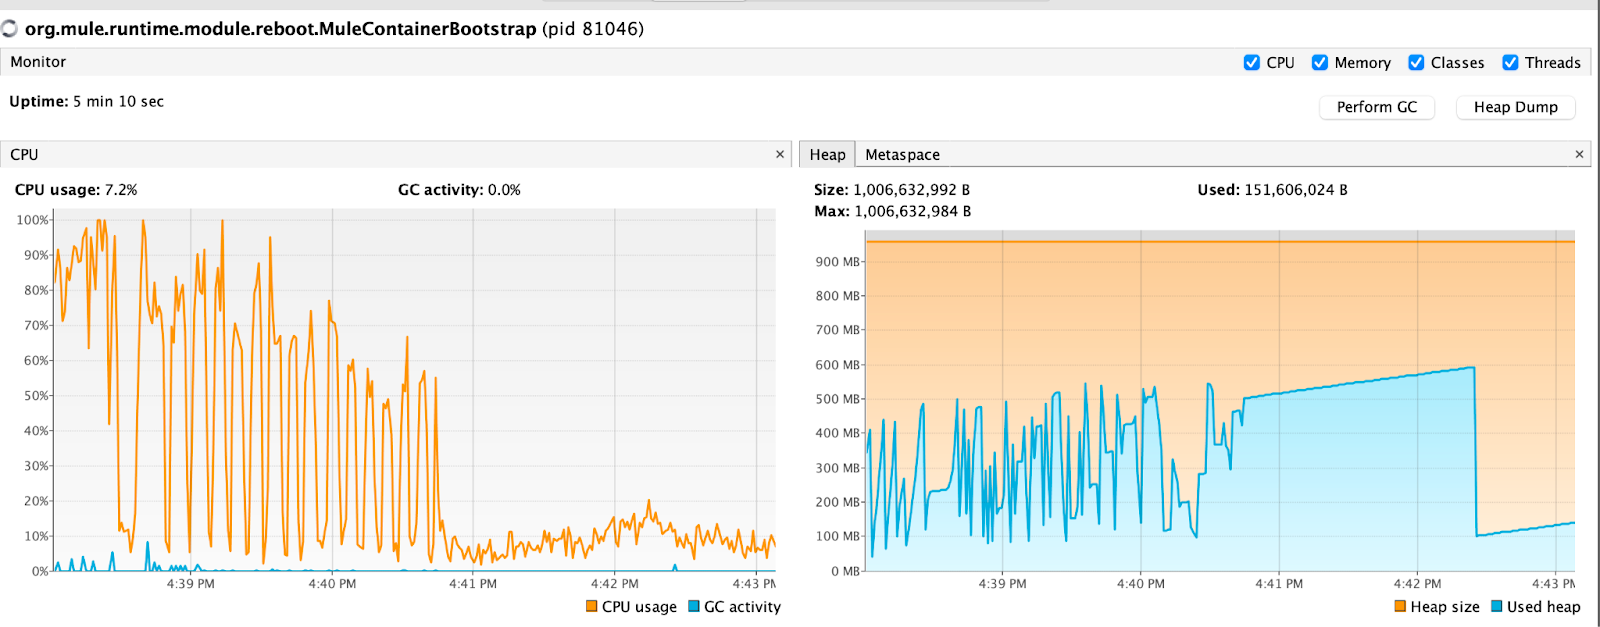
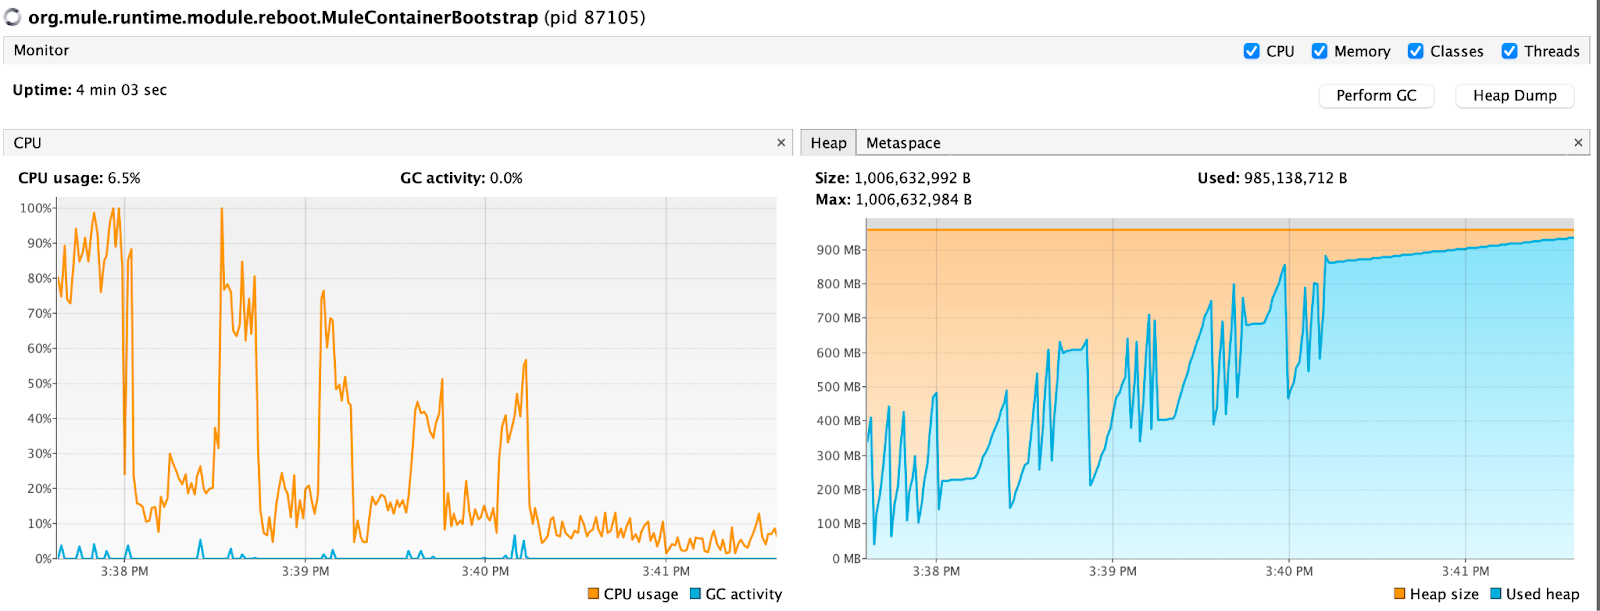
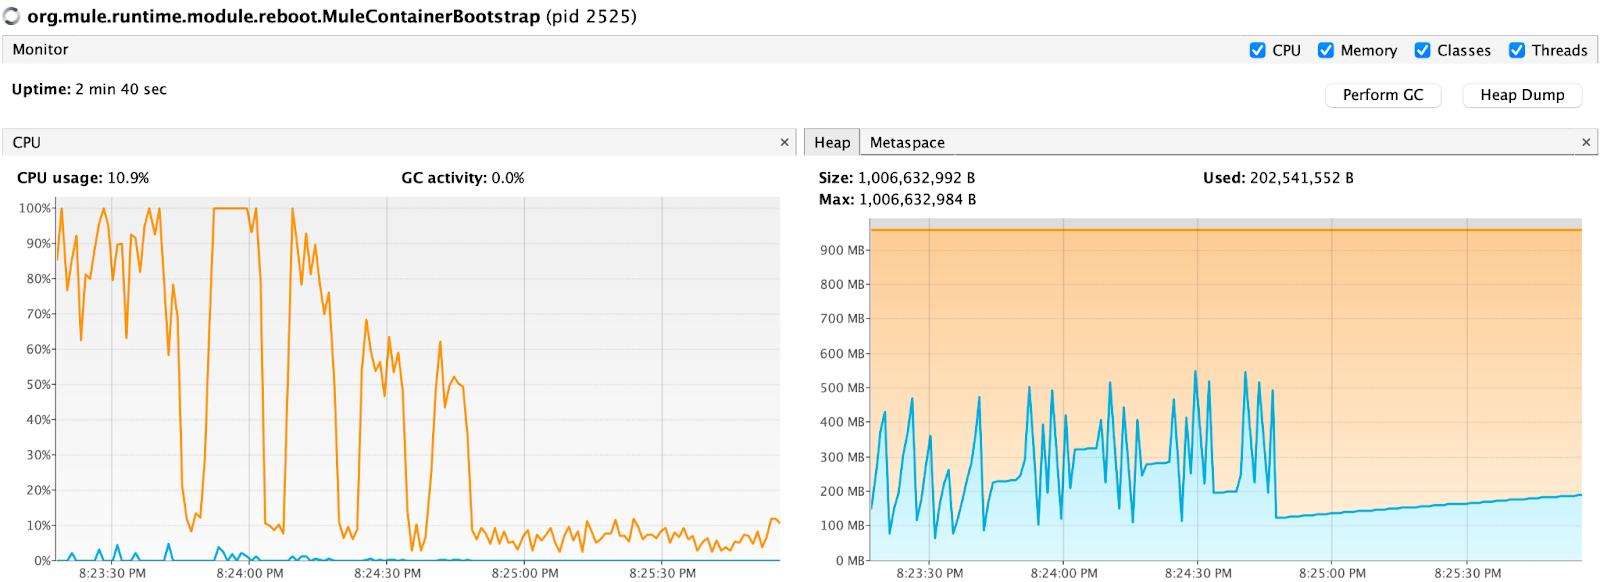
Loading the data directly to Kafka took 2 minutes 12 seconds and memory usage is similar as before when I don’t use the Streaming Response. (Seems like Garbage Collector didn’t kick in on the last period but processing was already complete). But since we didn’t transform the data CPU usage seems eased down.
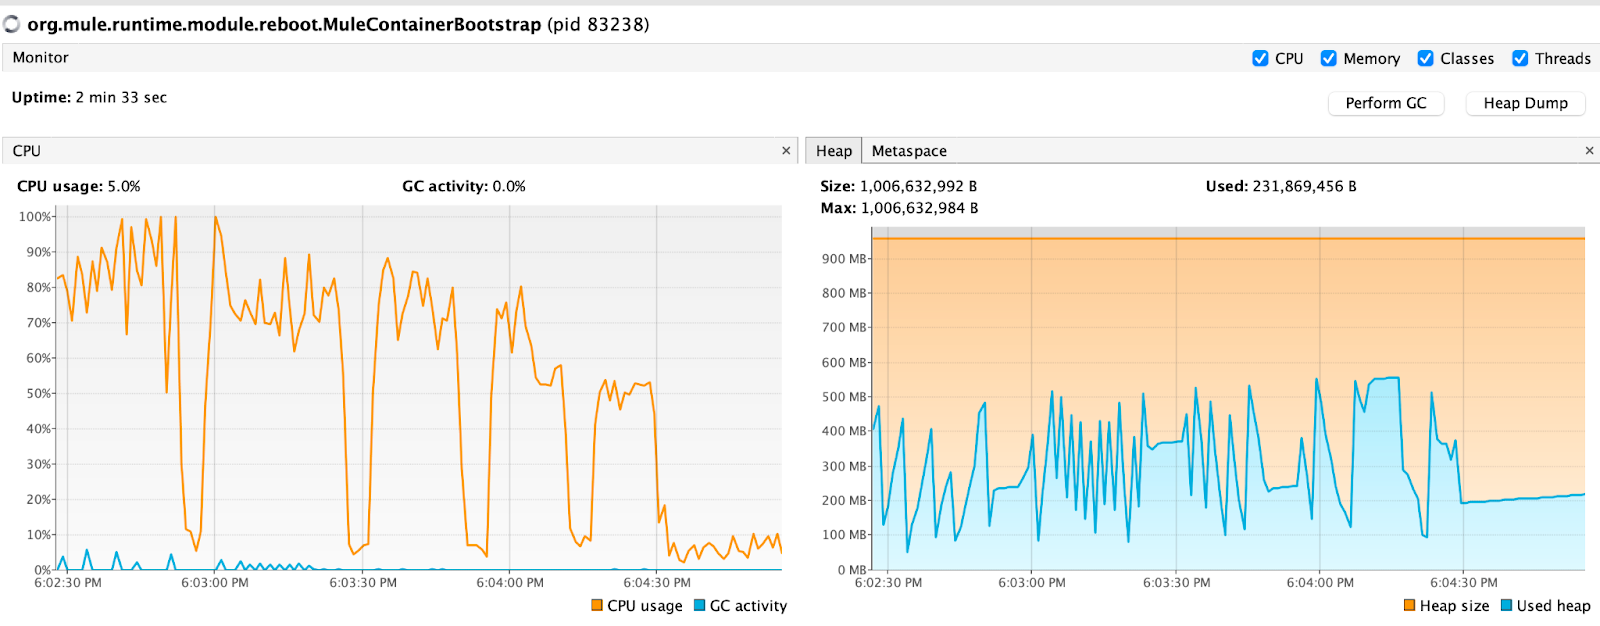
I also tested it with Parallel For Each instead of For Each in order to take advantage of remaining memory. Here are some results for parallel for each usage.
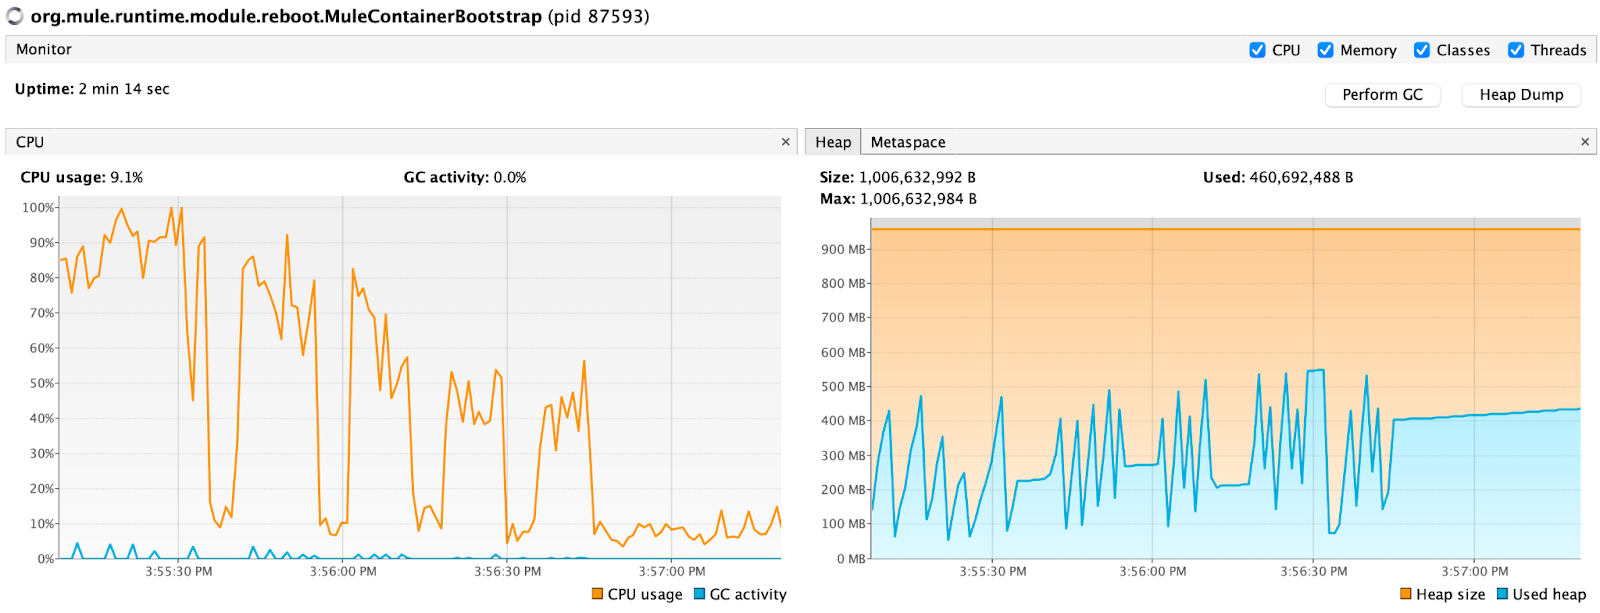
Loading 15319 events took 1 Minute 4 Seconds with 5 max concurrency and max used heap size is 559 MB. There is some more usage on CPU here.
Next I increased the max concurrency to 10 for the same amount of data and it took 1 minute and 3 seconds. API still calls for 4000 invoices on every call. So increasing the max concurrency and changing the Partition Strategy from DEFAULT (always the same partition) to ROUND_ROBIN does not change the total write time.
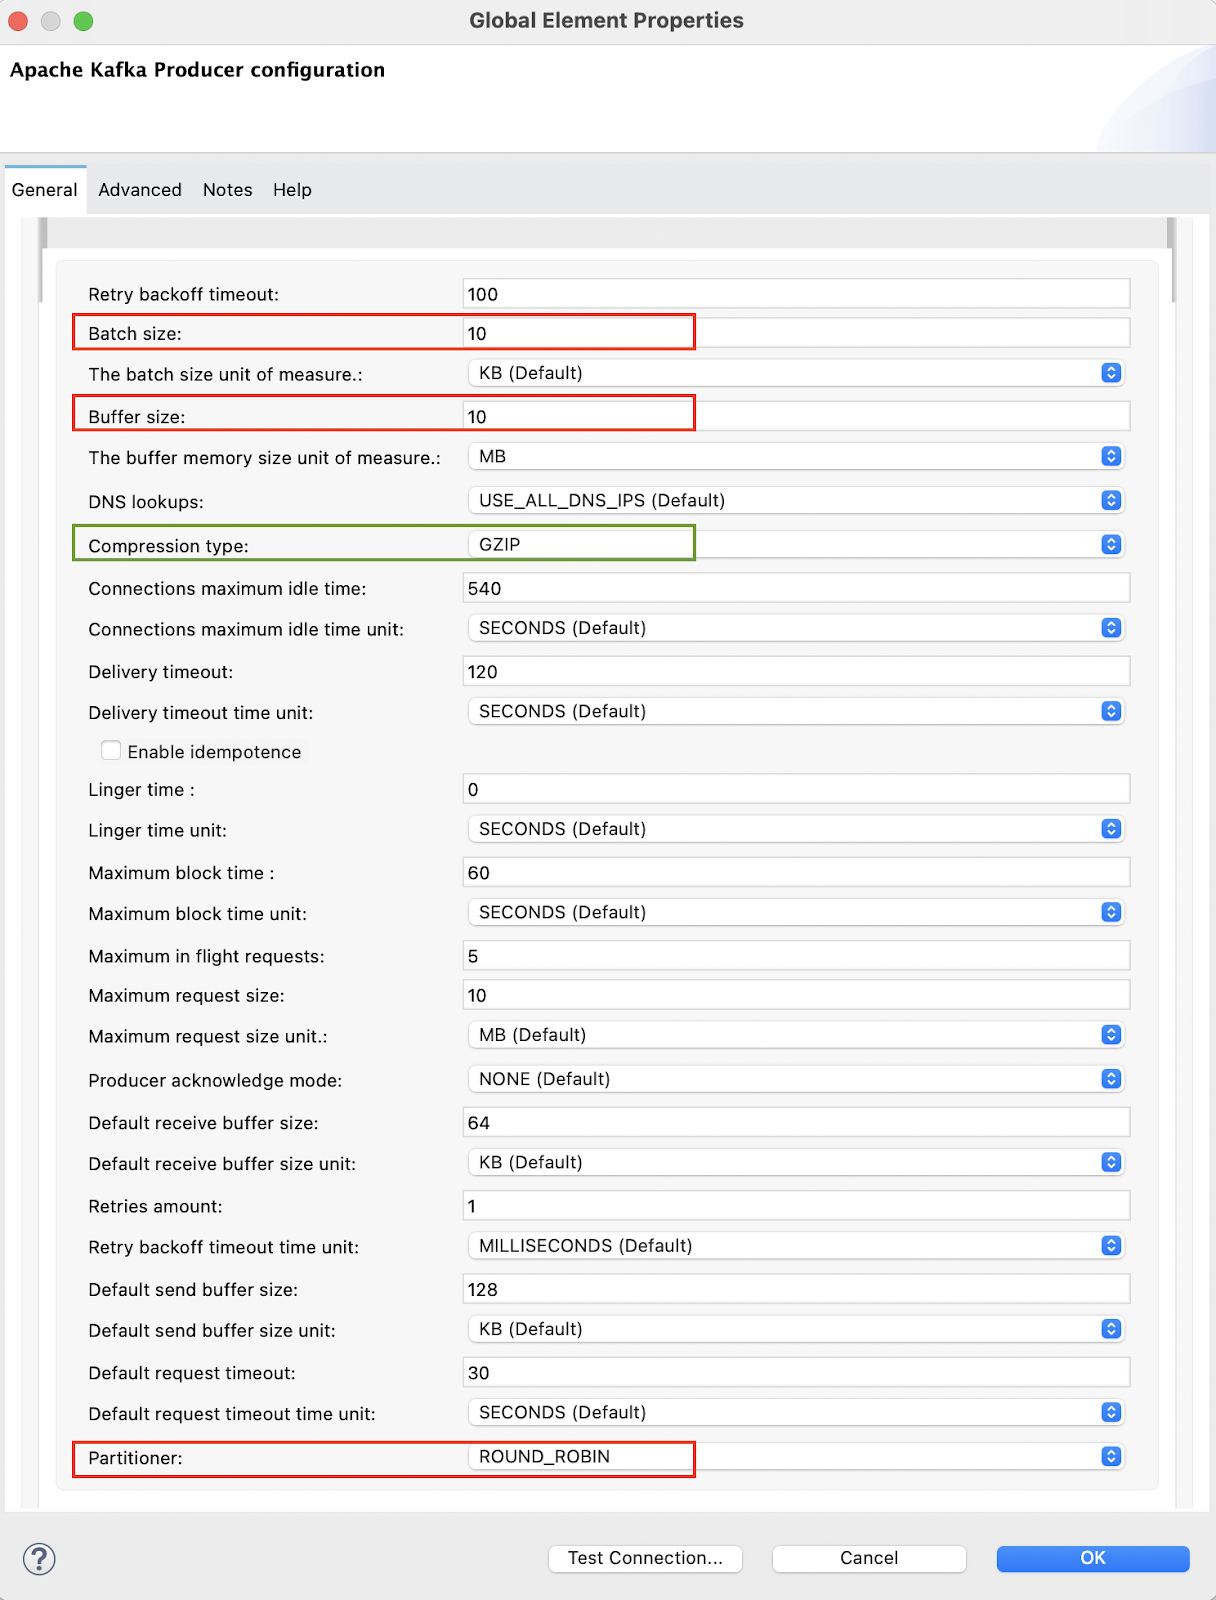
These were mostly the Mulesoft flow design changes. I also try to finetune the kafka connector. This picture shows the last configuration I used. The red boxes show changing those values did not increase the total performance or to memory consumption but changing the Compression type really helped. Default value for it is NONE, but when I changed it to GZIP total processing time of the same amount of data changed to 48 seconds for parallel for each with 10 max concurrency for 4000 per API call. It is another %25 increased performance on total time. Brokers and consumers will then have the added overhead of decompressing them, but the overall latency is reduced as the physical size of data transmitted over the network is smaller.