
An introduction on Elastic
Elasticsearch is a versatile search and analytics engine, designed for fast and scalable data storage, retrieval, and analysis. It utilizes a distributed architecture, allowing it to handle large volumes of structured and unstructured data efficiently. With its powerful full-text search capabilities, Elasticsearch enables users to search and analyze data in near real-time. Its flexibility, speed and extensive feature set make it a popular choice for various applications, from search engines to log monitoring and data analytics platforms.
What is observability?
What is it?
Observability refers to the ability to gain insights and understand the inner workings of complex systems through the collection, analysis, and visualization of relevant data. It involves practices and tools that enable real-time understanding, diagnosis, and debugging of system behavior, performance and health.
The challenges
- Tool sprawl is not new, but more costly now
- Non-centralized – information is spread over tooling
- The same data to serve various stakeholders
- Pricing models are not in line with observability goals
What does observability address?
Common questions that can be addressed by an effective observability solution
- How is the system performing overall? Are there any bottlenecks or performance issues affecting its responsiveness?
- Are there any anomalies or unusual patterns in system behavior or performance that require investigation?
- Which components or services are consuming excessive resources, such as CPU, memory, or disk usage?
- Are there any errors or exceptions occurring in the system? What is the frequency and impact of these errors?
- What is the response time and latency of critical requests or transactions? Are there any specific operations or endpoints causing delays?
- How does the system handle increased user traffic or load? Are there any scalability concerns?
- Are there any dependencies or interactions between different components of the system that may impact performance or reliability?
Why do we need it centralized?
Centralized data in observability provides a unified and comprehensive view of system behavior, facilitates correlation and context, simplifies management and access, enables cross-system visibility, and supports collaborative analysis. These benefits are crucial for effective observability, troubleshooting, performance optimization, and decision-making in complex and distributed systems.
Observability solution with Elastic
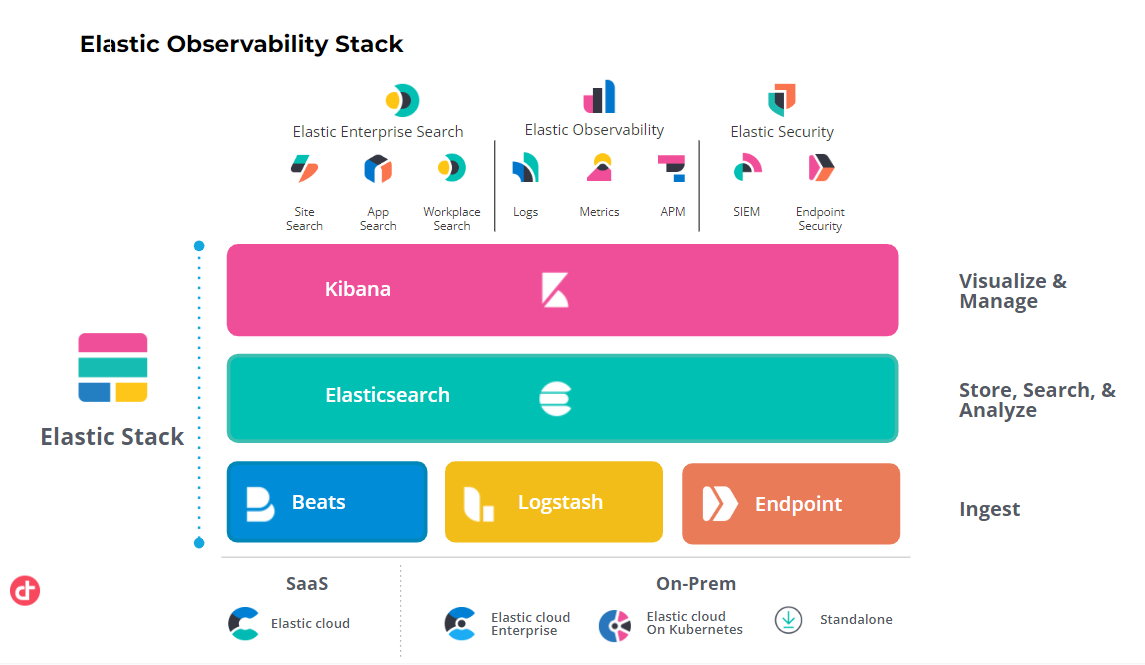
Elastic provides a unified observability solution, which is designed to help users gain insights and observability into their applications and infrastructure. The Elastic Observability stack consists of several key components:
- Elastic Logs: This component allows you to collect, store, and analyze log data from various sources. It provides centralized logging capabilities, making it easier to search, correlate, and visualize logs for troubleshooting and monitoring purposes.
- Elastic Metrics: With Elastic Metrics, you can collect and analyze metric data from systems, applications, and services. It supports the collection of various types of metrics, such as CPU usage, memory usage, network traffic, and more. The collected metrics can be visualized and monitored in real-time.
- Elastic APM (Application Performance Monitoring): Elastic APM helps you monitor and trace the performance of your applications. It provides detailed insights into the performance characteristics of your application, including transaction response times, error rates, and database queries. This information is invaluable for identifying performance bottlenecks and optimizing application performance.
- Elastic Uptime: Elastic Uptime enables you to monitor the availability and responsiveness of your websites, services and APIs. It periodically sends requests to your endpoints and tracks their uptime and response times. You can set up alerts and visualize the status of your monitored endpoints on dashboards.
- Elastic Synthetics: Elastic Synthetics allows you to simulate user interactions with your applications and websites. It helps you proactively monitor critical workflows and identify potential issues before they impact real users. Synthetics allows you to create personalized interactions, such as initiating logins, clicking various buttons, submitting forms, and monitoring their effectiveness.
- Elastic SIEM (Security Information and Event Management): Elastic SIEM combines security event data with observability data to provide comprehensive security monitoring and threat detection. It enables you to detect and investigate security incidents by correlating security events, logs and metrics.
By leveraging the Elastic Observability stack, organizations can gain comprehensive insights into the performance, availability and security of their applications and infrastructure. The stack offers powerful search, analysis, and visualization capabilities to help users monitor, troubleshoot, and optimize their systems effectively.
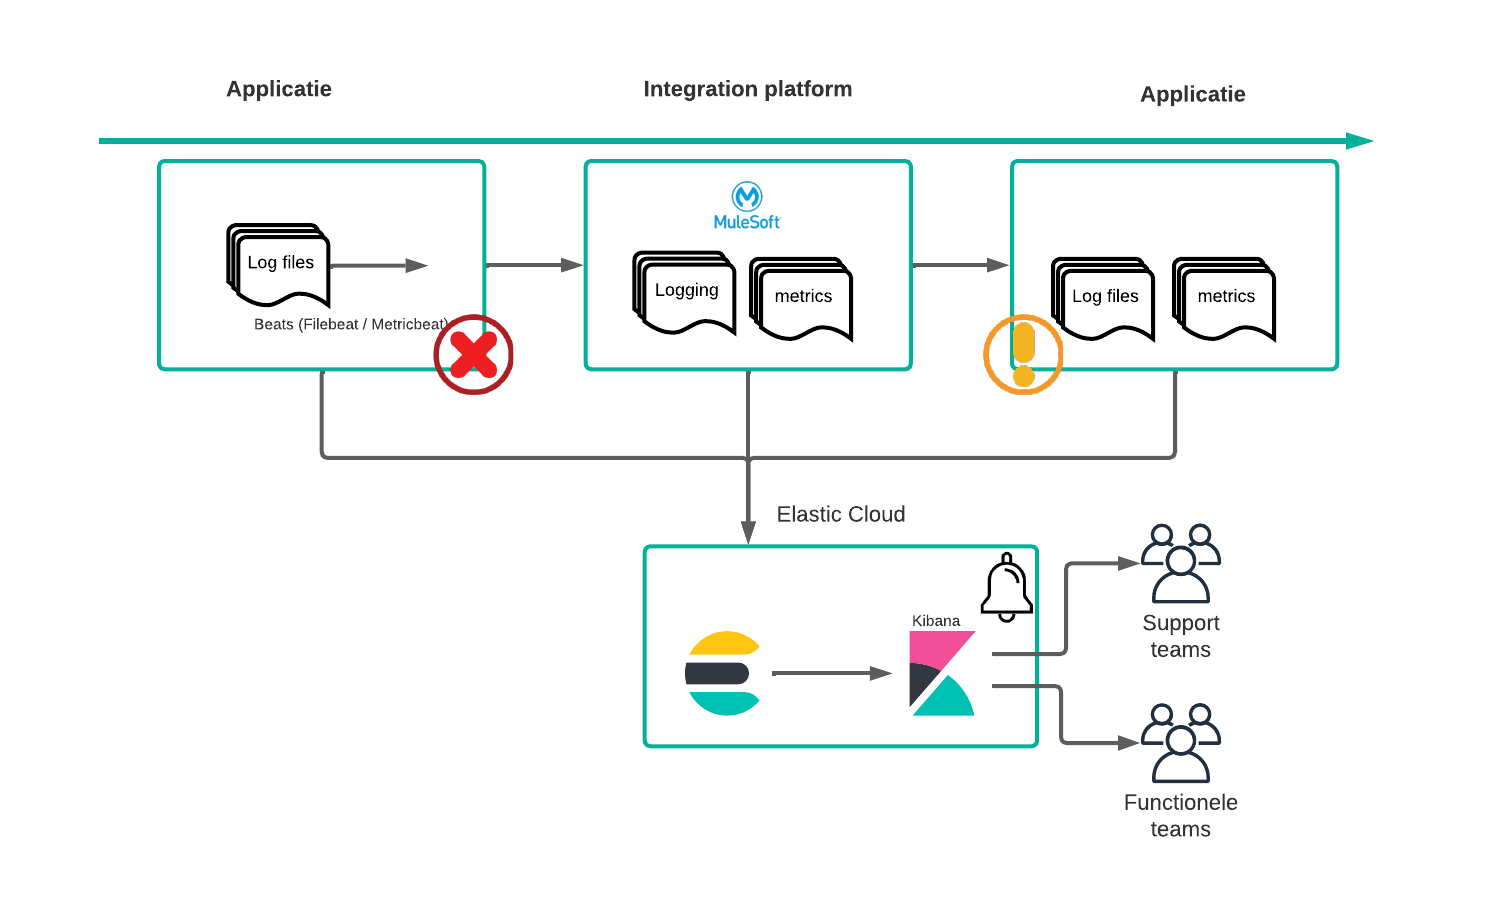
MuleSoft view
How are we monitoring?
We are essentially monitoring three parts:
- Individual APIs
- Control plane metrics
- API Uptime
In the context of individual application logs, we are pushing standardized messages that contain essential information to debug our flows. These standardized messages contain identifiers that allow us to identify a message from 2 perspectives:
- An end-to-end perspective: from one source system to our APIs to a destination system
- A MuleSoft perspective: all communications within our APIs
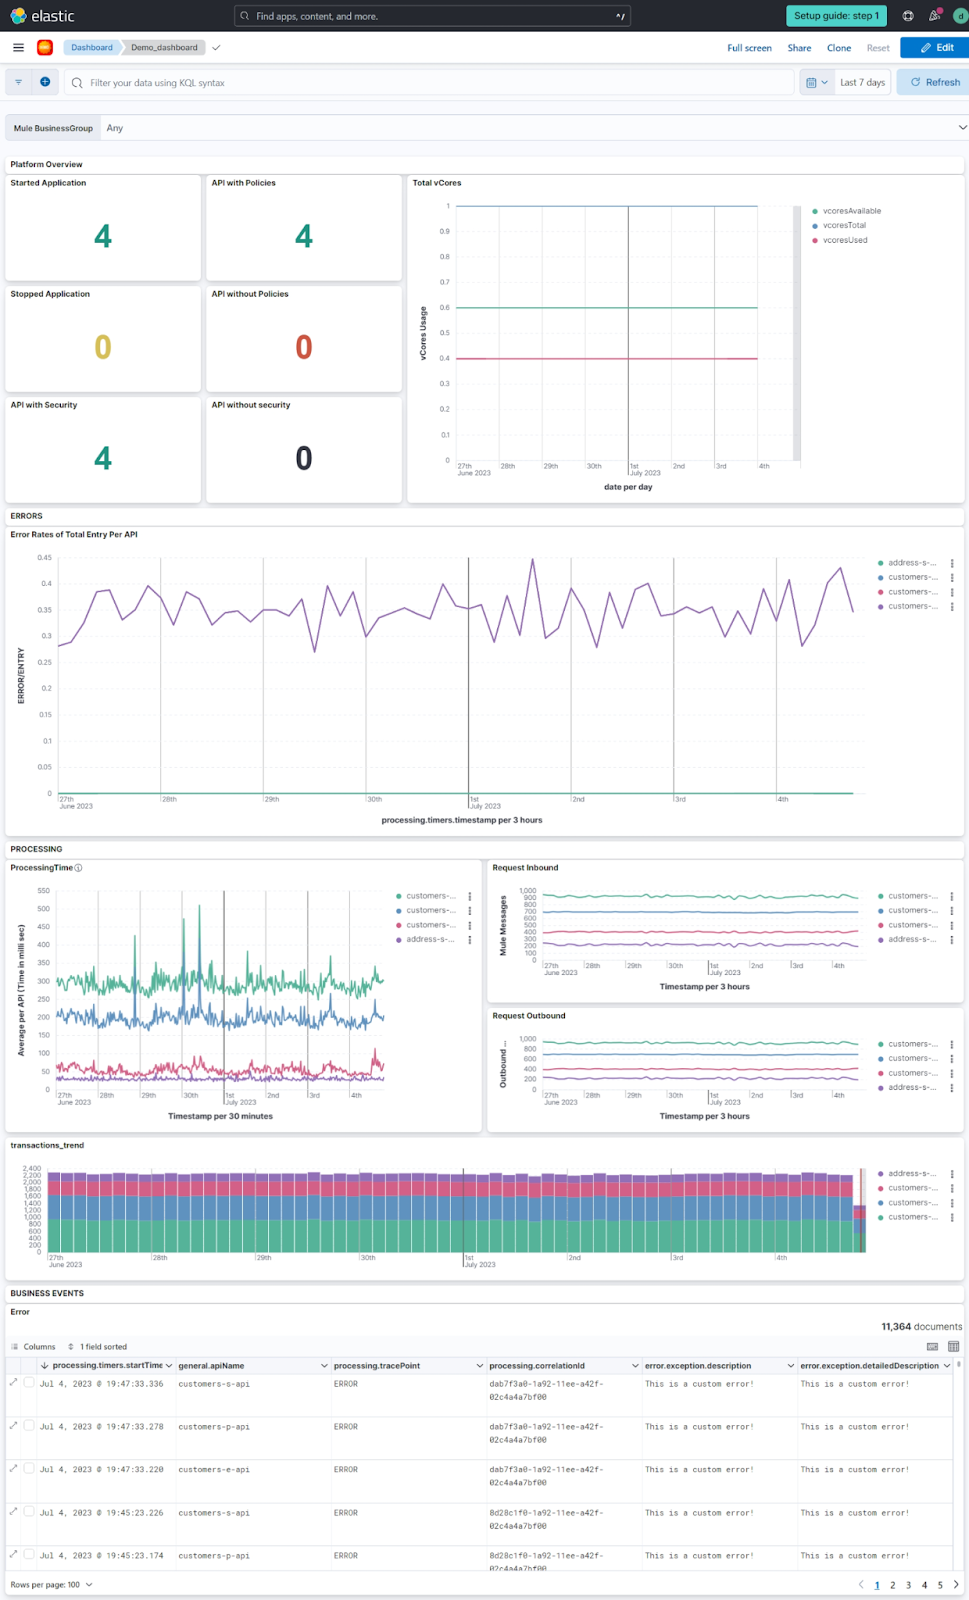
In the context of control plane metrics, we are essentially querying the platform APIs and extracting platform operational metrics. These metrics include and are not limited to:
- Number of started/stopped APIs
- Number of APIs with/without policies
- Number of available vcores across different business groups
In the context of API uptime, we are periodically querying the health endpoints of our APIs allowing us to effectively monitor their uptime.
Use-case examples
Demo of the Elastic dashboard
Below serves as a demo dashboard on what can be viewed within Elastic:
Conclusion
To summarize, Elastic’s rich toolset offers a unified layer that enables organizations to seamlessly track and analyze end-to-end messages, allowing them to gather valuable performance metrics and insights. Pushing MuleSoft operational metrics and API logs to Elastic becomes a very powerful tool that drives observability over the entire integration landscape. With the latter in place, API developers , monitoring teams and business users can now access one system for a unified view of the landscape. Business teams can receive alerts relevant to their business use-cases or access dashboards for their business KPIs. Monitoring teams can view API uptimes, while ensuring the health of the platform and API developers can drill down and debug their API flows.

