For one of our clients, we both develop APIs and manage the complete API management platform. So developing and building the APIs is basically our biggest task. However, we consider monitoring the API management platform as the next important step. It is simply vital to always know how your services and APIs perform!
It doesn’t really matter whether you are providing API services from one business unit to another, or providing API services from one company to the other. In order to generate revenue from the API consumption, you need to have insights and an overview of the performance and usage.

Observability and monitoring are terms that pop into my mind (hopefully to yours too!). In my opinion, visualizing and creating a monitoring structure and overview is the way to go.
So how can you quickly create an overview? The quickest (and dirtiest) way is to give someone the task to query the database and get numbers into excel. This is one way of doing it, but it can be very time consuming and inflexible to create an overview like this. What if you need some more data (or less), or even a different angle?
The best approach is to simply use some good monitoring tools! I’ll recommend you an awesome one in the next paragraph.
The Monetization Of APIs
My preferred monitoring tool of choice is Elastic. This tool has a couple of different modules that let you easily move data from the database to Elasticsearch indexes. This can be done using one of the modules filebeat, metricbeat, logstash, and so on.
Once your data is indexed, you’re ready to go. Keep in mind that it’s vital to know the data you work with, in order to have correct graphs and numbers to work with.
Ín order to make API data useful for monetization, we need to figure out what is important:
- Application or Consumer API base path
- HTTP Status codes, successful or unsuccessful
- Duration
- Response times
- And maybe other parameters to split or optimize the data
- Use conditional logic
- Tracking trends
Once you’re finished with organizing the data in filters and graphs we can add the monetization part to it. This could be adding the actual cost of a single API, or just use the data as it is and calculate with the numbers.
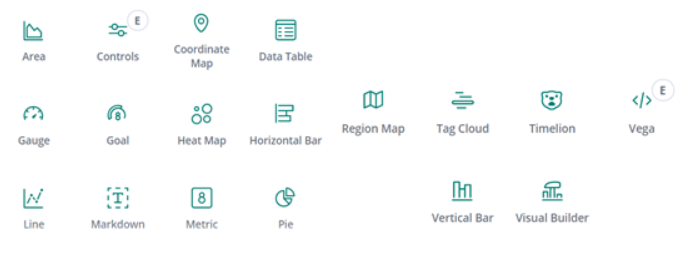
With the Elasticsearch ELK stack comes Kibana (a visualization tool within the stack). This tool contains multiple features that will enable you to create the dashboards and reports for monetization.
Tip 1: use Timelion to create powerful visualizations to use in Dashboards.

Tip 2: use Canvas to create live and info style presentations or reports.

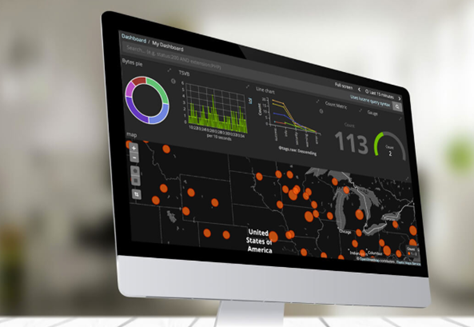
Create cool and informative Dashboards, using many different visualizations.
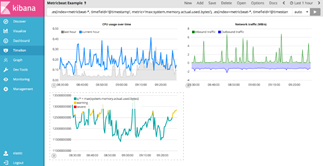
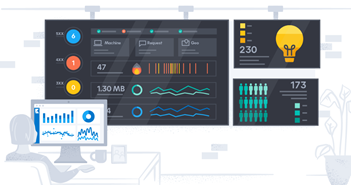
The examples below are taken from the elastic web site, but just imagine what your dashboards will look like and how useful they will be to your business.
Example 1:

Example 2:

You can generate revenue from the API consumption when you offer your services as Products.
Grouping APIs as Products:
- Functional perspective (coherence)
- Usage perspective (Bronze, Silver, Gold)
Generate revenue from API usage
- Apply longer-term quota
- Apply rates to usage
- Generate invoices
It is my passion to work on monitoring and observability solutions, and using monitoring tools for API monetization is just one of a thousand possible examples and use cases.
Want to learn more about monitoring?
It is very common for IT departments to be found rushing around looking for the facts in order to resolve problems that have been highlighted by the business. The use of monitoring ensures that you know where the problems lie before the business is even aware of them.
