
With Elastic Audit Logging, you can keep track of security-related events, such failed authentication attempts and rejected connections, to keep an eye out for any unusual behavior in your cluster (including data access authorization and user security configuration changes). With Devoteam we have implemented Audit Logging for the company ‘de Watergroep’. Below you will read what has been done and what the results are of these implementations.
What is Elastic Audit Logging?
When Elastic Audit Logging is activated, it is possible to make an overview of the usages of Kibana, for example, spaces and dashboards. The main reason for creating these dashboards is because there are no other dashboards to provide similar information. These dashboards can be helpful to see how frequently Kibana is used. It is a good analytic to know if a dashboard is used, that has been created with the user group input. Audit logging provides more information. As index we use the elastic_cloud_logs_* index, which is filebeat related. However, it is not only dashboard usage, it will allow you to see who is accessing the environment. This is something that could be GDPR sensitive depending on what this information is used for.
Get to know the usages of Kibana/Elastic
Issue: We have upgraded the first node to version 8.1.1 and restarted the node. Started Elasticsearch gave the error “there are version 6.6.2 indices At the company “De Watergroep” the majority of its employees werenot aware of the possibilities that an Elastic/Kibana environment could have , at least not in detail. Therefore, they started a POC for 6 months to get a clear overview of the usages within an environment.
During the POC, they wanted to know the usages of Spaces since there are 15 different Domains/Spaces, and around 50 dashboards they pay a monthly fee for. To get more control we’ve created a dashboard where they can see the number of users, dashboards, indices, and Discover usage and finally an overview of which dashboards are used. Since the dashboards only provide the ObjectId, we had to use a filter to give the actual name of the dashboard in the visualization. Moreover, since this was a manual action that needed to be done, it could take some extra time for maintenance.
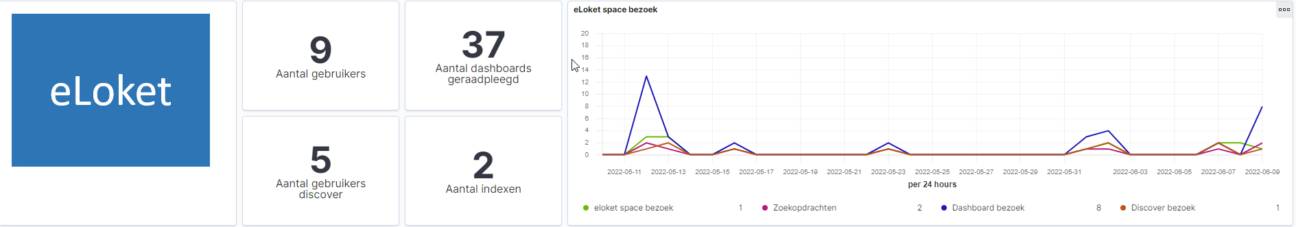
Daily usages of dashboards
There can be several reasons why dashboards are not used frequently. It is possible that due to changes in a specific department, the new staff might not aware of these dashboards and that we, as the Elastic team, should proactively contact them and inform them to go over the dashboards in order to be up to date with the latest updates. Keeping track of dashboards or analyzing them is not a daily routine. If there are any issues, it is would be a good thing to analyze the data. This might be a reason as to why dashboard usage is relatively low. It can also help when new deployments are being done.
Finally, the Elastic team at Devoteam has made sure that everyone at ‘de Watergroep’ is now able to have a clear overview of everything that needs to be taken into account with Elastic/Kibana. This overview allows the users to know what dashboards are used and how often they are used as well as other sets of data and indices etc. This allows the company to not let any of the not used dashboards or spaces to go to waste and increase efficiency and effectiveness.

