A major oil & gas company
This oil/gas company, formed more than a century ago, has operations in more than 50 countries worldwide, employing over 80,000 people who handle processes going from production and refining to trading. With cutting-edge technologies they aim to build a sustainable (energy) future.
The challenge: turn the available data into valuable information
The company in question came out of a long period of high oil prices where they did not have to worry much about cost. However, the sudden oil price drops of 2009 and 2015 woke organizations in the oil and gas industry.
In 2015 the upstream branch of this client had just some insights in their core business but not much. They did for instance not know exactly how much it costs to produce one barrel of oil at a specific oil well. This is not very shocking, since this market never had to worry about cutting costs due to the ever-sising oil prices. However, in a market where your product is losing value every day you’d want to know where to cut costs and how to increase the profit per barrel. In short, you need to get information out of your data.
To sum it up, the complete picture of challenges our client faced were the following:
- Not enough insight into the core business
- To many data sources
- How much do we produce?
- What is our maximum production?
- How much deferments do we have?
- How much does it cost to produce one barrel of oil?
- Which measures yield the best result?
- How much injection do we do?
- How many accidents have occurred on the platforms?
The solution: dashboards that improve strategic & operational decision-making
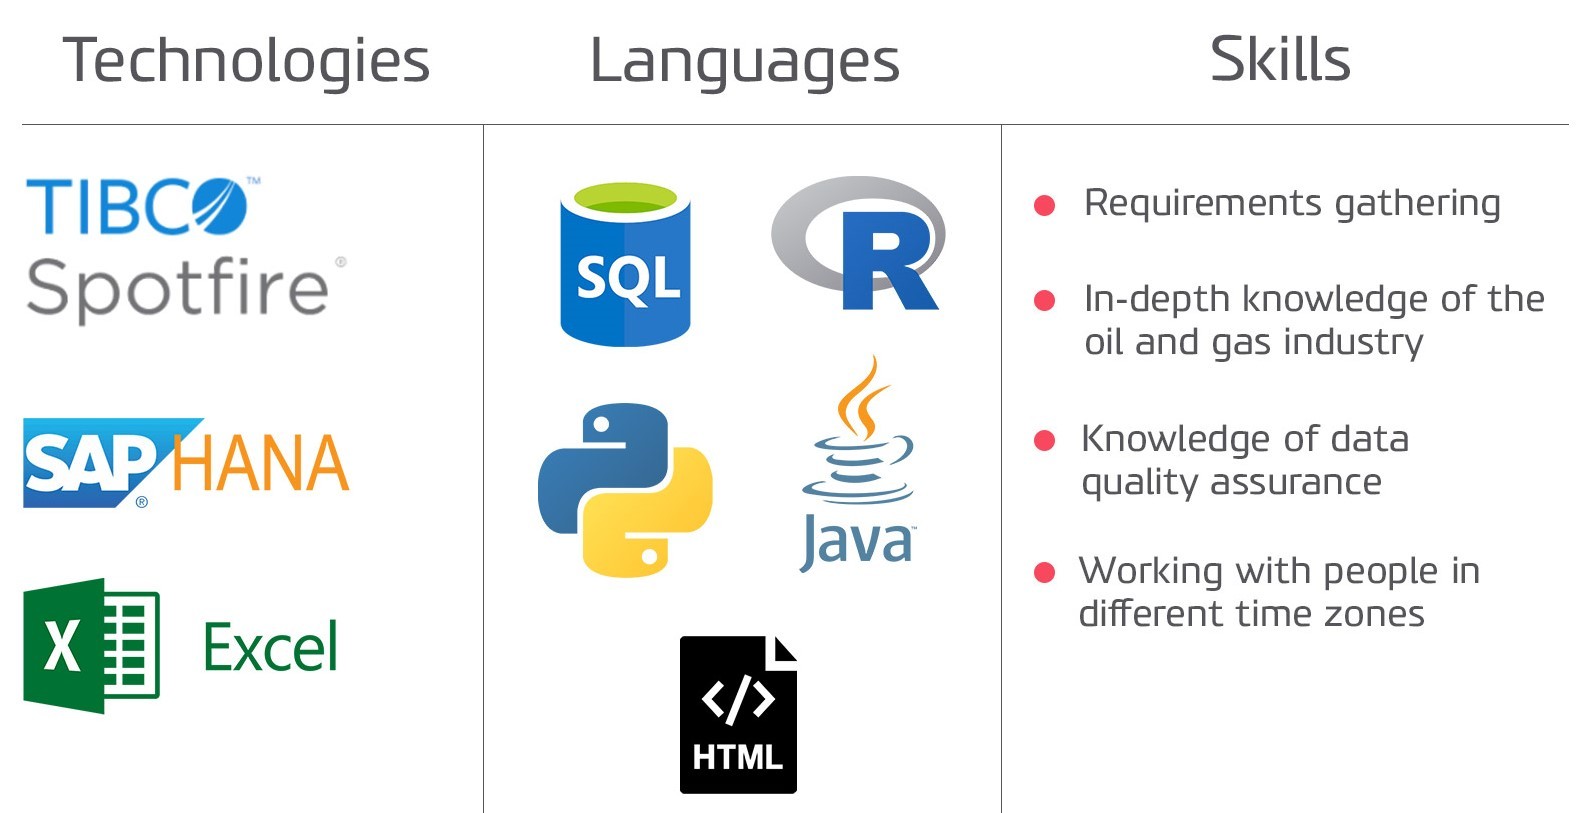
We proposed to create a stack of reports that would give more insight into our client’s core business. Within this clients company they were already using Tibco Spotfire. Because of our long-standing partnership with Tibco and extensive Spotfire knowledge we also prefered to work with Spotfire.
In order to start working on the reports, we first had to redesign the data layer because the data was spread over many sources and many different locations world-wide. We started with collecting a large part of the data in a Data Warehouse and created ETL (Extract, Transform, Load) and data cleansing processes.
After the data was ready to be analysed we started a data discovery journey together with our client’s business people, where we showed them what data was available and what kind of analyses we could make. These sessions with the business pushed the project further because they provided us with detailed knowledge and logic about the oil and gas drilling processes.
In the end we created a large amount of reports and dashboards that helped our client in understanding their core business, which led to better strategic and operational decision making.
All challenges faced an solved
The client’s challenges were solved by the following short- and long term solutions we designed and implemented:
Short-term solutions
- Reports in Tibco Spotfire based on data-in-production databases and SAP finance system
- Around 50 Spotfire files; each file leading to at least 20 different dashboards
- Predictive analytics on production
Long-term solution
- Set up a data platform
- Integrate 30+ different databases into the data platform
- Build sustainable dashboards which are easy to maintain
- 30 Spotfire files with 30+ dashboards
- Predictive maintenance
- Predict the best WRFM (Well, Reservoir and facility management) interventions
Required knowledge & multidisciplinary skills
