
In this blog, we are describing our experiences, process, and associated potential pitfalls when upgrading the ELK stack version 7.x to 8.x. The following components were upgraded: Elasticsearch, Kibana, APM, beats (windows and Linux machines), and Logstash (windows and Linux machines).
The upgrade to ELK stack 8.x must be classified as a major upgrade since the internal architecture of the 8.x stack is different from the previous version 7.x. This is also the reason a roll-back is not possible from ELK stack 8.x to 7.x.
The upgrade process must be done in two steps: the first upgrade to v7.17 followed by the subsequent upgrade to v8.x.
Finally: it was well worth the time and effort since the end-user experience from a performance point of view is much better. Engineers and some active users experience a significant improvement in response time!
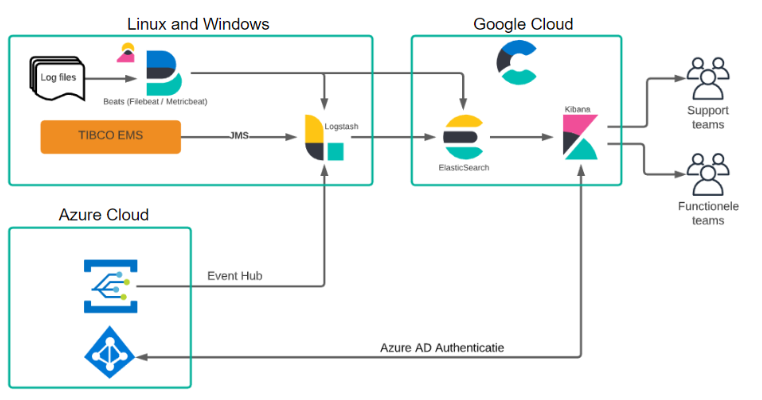
As a reference, a simplified schema of our Elasticsearch setup is shown in the figure below.
Upgrade to 7.17
The upgrade process from 7.x to 7.17 can be considered a minor upgrade. The upgrade process is straightforward. Using the Google Cloud Platform for Elastic allows the user to simply use the upgrade button provided in the deployment platform. A “rolling” upgrade is performed. We have also upgraded all the beats (Metricbeat/Heartbeat/Filebeat) and Logstash to 7.17 on the windows and Linux machines. All without any complications. Upgrades on other Cloud Platforms like AWS, and Azure should be similar.
When version 7.17 is installed the Upgrade Assistant becomes available. The Upgrade Assistant generates a list of issues: Criticals and Warnings for both ElasticSearch and Kibana that must be solved before the upgrade to 8.x can be performed.
Below are several issues described that we ran into including the solutions.
- Setting “xpack.monitoring” is deprecated and has been replaced by “monitoring”.
- Solution: Remove “xpack.monitoring” from the logstash.yml on Windows and Linux server and replace it with “monitoring”.
- The “xpack.reporting.roles” setting is deprecated
- Solution: Set “xpack.reporting.roles.enabled” to “false” in kibana.yml. Remove “xpack.reporting.roles.allow” in kibana.yml, if present.
Go to Management > Security > Roles to create one or more roles that grant the Kibana application privilege for Reporting. Grant Reporting privileges to users by assigning one of the new roles.
- The array format for “xpack.security.authc.providers” is deprecated
- Solution: Remove the “xpack.security.authc.providers” setting from kibana.yml and add your authentication providers using the new object format.
The following changes must be done in kibana.yml
xpack.security.authc.providers:
saml.cloud-saml:
order: 0
realm: cloud-saml
description: ” “
icon: ” “
- Solution: Remove the “xpack.security.authc.providers” setting from kibana.yml and add your authentication providers using the new object format.
- “xpack.security.session.lifespan” is now 30 days. Users are automatically required to log in again after 30 days starting in 8.0. Override this value to change the timeout.
- Solution: Solution: To configure a custom timeout, set “xpack.security.session.lifespan”.
Use the format <count>[ms|s|m|h|d|w|M|Y], for example, 20m, 24h, 7d, 1w. A value of 0 disables the timeout.
The following changes must be done in kibana.yml
xpack.security.session.lifespan: “48h”
xpack.security.session.cleanupInterval: “1d”
- Solution: Solution: To configure a custom timeout, set “xpack.security.session.lifespan”.
Upgrade to 8.x
We have started the upgrade process to 8.x after all the issues from the Upgrade Assistant were resolved. From the Cloud deployment, we have started the “rolling” upgrade to 8.2.3. Elasticsearch, Kibana, and APM were upgraded automatically without any issues. Subsequently, we have started upgrading Logstash on the local Linux server. The following issues appeared:
- We received a notification that, while performing a yum install for Logstash, version 8.2.3 couldn’t be found.
- Solution: Solution: Change in /etc/yum.repo.d the logstash.repo to include version 8:
/etc/yum.repo.d/metricbeat.repo
[metricbeat-8.x]
name=Elastic repository for 8.x packages
baseurl=https://artifacts.elastic.co/packages/8.x/yum
gpgcheck=1
gpgkey=https://artifacts.elastic.co/GPG-KEY-elasticsearch
enabled=1
autorefresh=1
type=rpm-md
- Solution: Solution: Change in /etc/yum.repo.d the logstash.repo to include version 8:
- Logstash 8.2.3 didn’t start and gave the following error:
[ERROR][logstash.filters.http ] Missing a required setting for the http filter plugin:
filter {
http {
target_body => # SETTING MISSING
…
}
}- Solution: This issue was solved by disabling the pipeline ecs compatibility in the logstash.yml: “pipeline.ecs_compatibility: disabled”.
Note, there is also a possibility to make the change per pipeline.
- Solution: This issue was solved by disabling the pipeline ecs compatibility in the logstash.yml: “pipeline.ecs_compatibility: disabled”.
- Logstash on Linux wouldn’t start, we received the following error:
[ERROR][logstash.runner ] Logging configuration uses Script log appender or filter with Javascript, which is no longer supported.
[FATAL][org.logstash.Logstash ] Logstash stopped processing because of an error: (SystemExit) exit
org.jruby.exceptions.SystemExit: (SystemExit) exit- Solution: The following properties have been removed from the log4j2 properties file:
appender.rolling.avoid_pipelined_filter.type = ScriptFilter
appender.rolling.avoid_pipelined_filter.script.type = Script
appender.rolling.avoid_pipelined_filter.script.name = filter_no_pipelined
appender.rolling.avoid_pipelined_filter.script.language = JavaScript
appender.rolling.avoid_pipelined_filter.script.value = ${sys:ls.pipeline.separate_logs} == false || !(logEvent.getContextData().containsKey(“pipeline.id”))
appender.json_rolling.avoid_pipelined_filter.type = ScriptFilter
appender.json_rolling.avoid_pipelined_filter.script.type = Script
appender.json_rolling.avoid_pipelined_filter.script.name = filter_no_pipelined
appender.json_rolling.avoid_pipelined_filter.script.language = JavaScript
appender.json_rolling.avoid_pipelined_filter.script.value =
${sys:ls.pipeline.separate_logs} == false ||
!(logEvent.getContextData().containsKey(“pipeline.id”))
- Solution: The following properties have been removed from the log4j2 properties file:
Filebeat: We started to upgrade filebeat to 8.2.3 on Linux and received the following error:
- {“log.level”:”error”,”@timestamp”:”2022-05-31T14:56:10.099+0200″,”log.origin”:{“file.name”:”instance/beat.go”,”file.line”:1038},“message”:”Exiting: module logstash is configured but has no enabled filesets”,”service.name”:”filebeat”,”ecs.version”:”1.6.0“}
This error appeared because the logstash.yml module couldn’t be found with the old configuration in the filebeat.yml:
filebeat.config.modules:
module: logstash
path: ${path.config}/modules.d/*.yml- Solution: In the filebeat.yml the following change must be made:
======================== Filebeat inputs ==========================
filebeat.config.modules.path: ${path.config}/modules.d/*.yml
filebeat.config.modules:
– module: logstash
path: ${path.config}/modules.d/*.yml
Subsequently, the logstash module had to be enable by the following command from the /etc/filebeat location:
/usr/share/filebeat/bin/filebeat modules enable logstash
- Solution: In the filebeat.yml the following change must be made:
Metricbeat: We have experienced an issue with the metricbeat upgrade to 8.2.3 on Windows
- We have noticed that no metricbeat data was received in Kibana.
- The issue was solved by directing the metricbeat data directly to Elasticsearch
instead via logstash. The following change was made in the metricbeat.yml:
setup.kibana:
#output.logstash:
# The Logstash hosts
#hosts: [“t-vmwlsbmon04.vmwitest.be:5043”]
#host: “https://xxxx.europe-west1.gcp.cloud.es.io:443”
# —————————- Elasticsearch Output —————————-
output.elasticsearch:
# Array of hosts to connect to.
hosts: [“https://xxx.europe-west1.gcp.cloud.es.io:443”]
username: ” “
password: ” ”
- The issue was solved by directing the metricbeat data directly to Elasticsearch
Kibana: We were facing some issues with Kibana
- All dashboards and Saved Objects were having a new URL! The cause is that all ID’s of the Dashboards and saved searches in Kibana must have an unique ID.
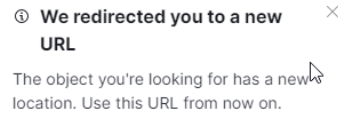
- All URLs are changed with the new address so that the issue does not appear.
- Audit Logging: After the upgrade, the index elastic-cloud-logs-7 changed to elastic-cloud-logs-8. Because we used elastic-cloud-logs-7* as an index pattern, we had to change the index-pattern/data view to elastic-cloud-logs-*. On the audit Dashboard, we have an overview of the Dashboard usage, here we needed to add all new objectIds to the filter, with the filter we add a label with the Dashboard title.
Conclusion
- Stack monitoring: We did not have Cluster monitoring information
- On Kibana we did not see any Cluster information in Stack monitoring, after disabling and enabling Metrics on our deployment it was working again.
Although we have read the release notes before the upgrade some of these issues could not have been prevented, such as the new URLs and some of the Filebeat and Logstash configurations. With this blog, we hope to have given enough insight into the upgrade process and pitfalls to prepare for a smooth upgrade yourself!
Working at Devoteam
We, as Devoteam, are simply the sum of 9,000 Tech Enthusiasts full of innovative energy. To increase our tech stronghold & density, we are constantly looking for talent and potential, from young professionals to experienced legends. Have a look at our vibrant culture and discover our company!

