Anticipate by looking forward and backward to learn what’s going on
My experience has taught me that many companies, institutions, or departments do not look at data over time (trends) a lot when it comes to observability or monitoring. That’s a shame, because insight into data by recognizing and actually seeing trends, is something that can make a big difference. Looking at information from the present says nothing about the information from an hour or a day ago, or what is to come.
Providing insight is something that has always fascinated me. Answering questions based on visible facts, or looking for new insights, is what drives me.
Insight into trends
Gaining insight from analyzing trends over time is not always easy. Product owners / Service Managers would like to have insight into application logs or application data. Others want insight into the infrastructure, such as server logs, error logs, network logs, CPU and memory usage, or combinations. Depending on the question or environment you are in, the combination of data is different.
The goal is always the same: When did something happen, did it happen before, and what was the cause? Is there growth or decline and on which hours or days was this the case?
Filtering data compared to the total amounts, in particular, provides good insight into the trend lines.
Valuable information
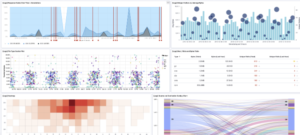
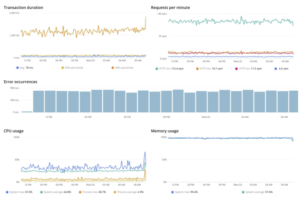
The graphs below could, for example, show data from an API Management platform, looking at both service data (transaction duration, errors, and requests per minute) and infrastructure data.
Trends over time are valuable for the generic operations of an organization, the introduction of new features, or perhaps Black Friday. Personally, I find the combination of application data and infrastructure data the most interesting. Is the performance of the application and infrastructure still strong with a high load? Or do you see that the application is under pressure during Black Friday, and how was that compared to the previous period? Trend lines over a longer period of time provide insight and clarity.
How to deal with peaks?
It is possible that peaks in errors and decreases in orders arise due to technical problems (underlying infrastructure). This can be due to various circumstances or dependencies that disrupt a rhythm.
Sale Event
Black Friday, CyberMonday, and holidays are times when peaks can be seen in trend lines of online purchases. If an expected peak of API transactions does not occur, this can have several reasons. A store’s website can’t handle the number of visitors or there is a problem in the online payment system. In this case, zooming in on certain hours of a day and comparing them with other moments can provide you with very useful insight.
Change in work due to Corona crisis
Since the beginning of this year, many people have started working more, or entirely, from home. This has undoubtedly led to problems with authentication systems and services. Usage has increased, but is the performance sufficient? Is the load balancer set up properly? Where do we have most of the problems? Looking at the trend lines of performance per realm, or simply of authentication data, will likely provide clear insight.
By having the data in a Centralized Monitoring tool you can make the data visible and turn it into useful tools. What is the trend and what are the trend influencers in that particular case. By visualizing data (over time) for different use cases, your chances of finding answers to your issues are much higher than before.
The Elastic ELK stack as a tool for trend analysis
With Elasticsearch you have a strong set of tools available that can provide insight by analyzing trends over time. The Elastic ELK stack (Elasticsearch, Logstash, and Kibana) is made for exactly this purpose (and more). It provides you with:
- Infrastructure metrics
- (Web) Server logs
- Application logs
- Application performance
- Security (SIEM)

By collecting data and logs in a central place (centralized monitoring), gaining insight from trends to answer certain questions suddenly becomes easy. It is a kind of lever that you use, exert a force that you don’t actually have. That’s how it works with Elasticsearch too. You let the system store, index, and distribute information. Elasticsearch enables you to search through using a timeline. By searching and making use of the timelines you’ll get the insights you would never have had without Elasticsearch.
Service desks or monitoring teams can quickly establish connections or see what causes an incident and take effective measures. They can, for example, respond quicker through smart alerts.
If you do not have a clear overview or dashboard:
- there is little or no (proactive) response to certain trends;
- you do not understand what the problems are or why there are complaints;
- you are unable to recognize recurring problems.
By defining alerts in a SMART way, you will be informed in time about a situation or specific use case, enabling you to act fast.
The solution: Elastic Centralized Monitoring
DevOps teams, and Business Owners or Product Owners of various applications/systems can use Centralized Monitoring (using the Elastic ELK Stack) to see what is happening in the organization. System administrators don’t have to waste unnecessary time checking tens or hundreds of logs where a problem has occurred. Data is centrally available in Elasticsearch indices and is aggregated by index patterns. You can search through countless logs with just a simple search.
A practical example
A team with application- and system administrators at one of our customers had no insight into the load balancing of their authentication system on production. By indexing the logs of administration and production servers into Elasticsearch via Logstash, it became possible to gain insight into this load balancing issue. By splitting the data on a histogram by hostname, the client gained insight into the number of transactions per server.
Once the data was available, we also displayed the authentication success rate over time in a timeline. By using the computing power of Elasticsearch in a timeline, or in TSVB (Time Series Visual Builder), insight into the percentage of successful and incorrect authentication attempts was gained. Because codes have to be entered from your phone in the browser, you sometimes make a typing mistake. It was interesting to discover that password errors occur more in the evenings and at night: up to around 50% of the login attempts were successful.
This is a spot-on example of insight gained from analyzing trends over time. In this case, the discovered insight could very well be used to create a solution to prevent typing errors in the evenings or at night.
At Devoteam, we believe it is crucial to be in control of your IT Landscape and Business Operations. We see centralized monitoring as the #1 solution to get you in charge. We do this with Elastic, our trusted partner, and market leader in monitoring solutions. Together, we apply value-adding technology at scale, with a proven track-record at customers such as Renewi and De Watergroep. At Devoteam we shape technology for people.
Don’t hesitate to contact our team of experts for any questions or to request a free (real-life case) centralized monitoring demo with Elastic.

