
Each week, a new “Do You Know” will be posted on our Elastic Technical Knowledge Hub to share useful knowledge to improve the observability using Elasticsearch. These topics originate from day-to-day challenges we solved for our clients. A stepwise description helps you to successfully implement solutions on improving the performance of your deployment and get the best monitoring of your applications using dashboards and alerting.
This week I will discuss: how to move from collecting logs with Filebeat to collecting them with the Elastic Agent.
Background
Traditional methods of collecting logs and metrics use Elastic beats like Filebeat, Metricbeat, and Winlogbeat. We see our customers increasingly moving towards the Elastic Agent to collect these types of data, fully replacing the individual Beats. Advantages include remotely updating the agent itself and managing configurations for data collection all from within Kibana.
This blog consists of two parts. The first part will explain how to set up the Elastic Agent to collect logs from a defined path and how to alter the data using Filebeat processors. The second part will explain how to use ingest pipelines in combination with the Elastic Agent to further transform your data.
Solution
DISCLAIMER: not all Filebeat inputs can be replaced by the Elastic Agent. Check the availability of an integration (known in Filebeat as input) here: https://www.elastic.co/integrations/data-integrations?solution=observability.
Step 1
We start by creating an agent policy. This can be seen as the configuration template of the Elastic Agent, instructing it on what data to collect, where to retrieve it from, and how to send it to Elastic. This template can be applied to one or multiple agents to simplify configurations. For example, if our application has five frontend servers from which we want to collect the same logs and metrics, we would simply create one template and apply it to all five Elastic Agents installed on the servers. Whenever we make changes to a template, the agents it has been assigned to will automatically be updated.
Returning to the example: we first create a template and call it ‘DVTNL-Elastic-blog-example’. To create a template, navigate to Fleet → Agent policies → Create agent policy, give it a name, and click ‘Create agent policy’.
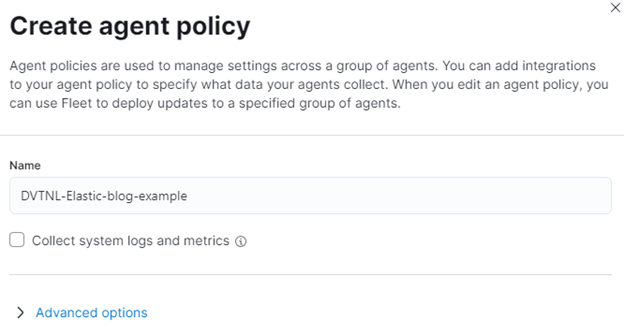
We get the option to collect system logs and metrics. Ticking this box will enable the collection of metrics such as CPU, memory, and load of the destination machine, as well as logs depending on the operating system. More information on this can be found here.
Step 2
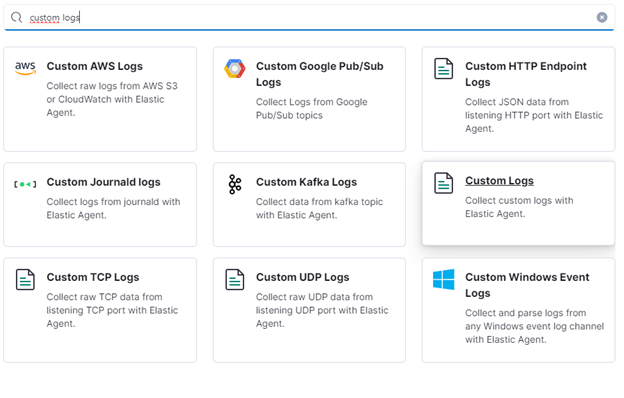
Elastic will ask where the policy should be applied; let’s skip that for now as we haven’t installed an agent yet. Go back to Fleet → Agent policies and click on the name of the policy you have just created. Now we can configure the agent and define what to measure. Data sources are called integrations in the agent policies. Click on Add integration in the top right corner of the screen, and you’ll see a list of all available integrations. For this example, we will use the custom log integration. This integration is comparable to the log input of Filebeat. It reads the log file(s) from the specified location(s).
Step 3
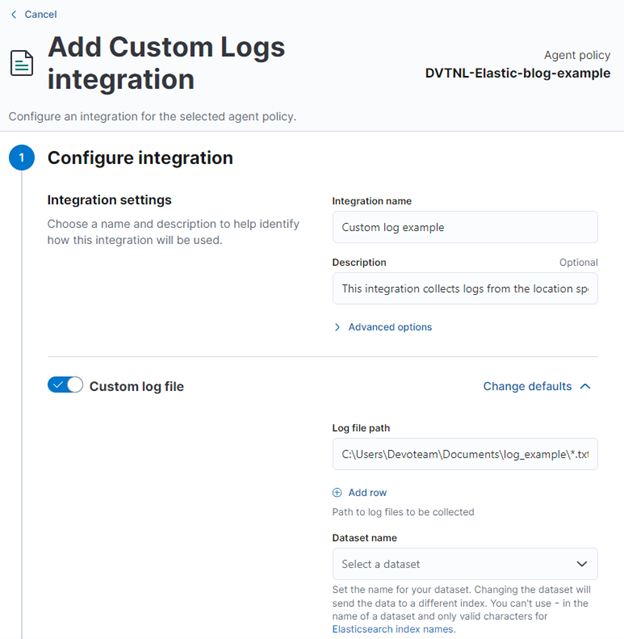
Once we have selected an integration, we will be asked to create a configuration in Kibana. For the log input, the only required field is the file location. The value of this field is the location where the file to be read is located on the machine where the associated Elastic Agent is installed. All other fields are optional, but can be very helpful when switching from Filebeat to the Elastic Agent:
- Processors: In this field, processors can be pasted directly from the Filebeat configuration. The processors specified here are the same as Filebeat processors.
- Custom configurations: Provide configurations other than those provided by the UI. Available configuration options can be found here.
- Ingest pipelines: Create a custom pipeline to transform data before it is stored in Elastic. Always create the ‘@custom’ pipeline, as this will be untouched during cluster upgrades. Edits made to the default pipeline will be reverted after every Elastic version upgrade. More details on ingest pipelines will be provided in a future blog!
- Mappings: This list shows the component templates applied to the destination index. Here you can define the mapping of your custom fields; always use the @custom template for custom mappings.
TIP: It is likely that you want to specify multiple locations where files should be read, but not the same processors or pipelines should be applied to all data sources. You can add the same integration multiple times to a single agent policy with different configurations for each.
Step 4
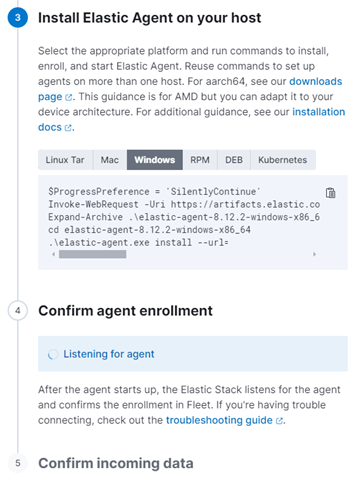
Once the policy is ready, the agent can be added to a machine. On the edit page of a policy, click on ‘Actions’ in the top right corner, and then click ‘Add agent’. Select the machine’s operating system and copy the command provided to the machine on which you want to install the agent. The script Elastic provides consists of three steps:
- Download the latest version of the Elastic Agent from the repository.
- Extract the files to the specified folder.
- Install the agent and pass the following parameters:
- The Fleet server URL where the data should be sent and where the configuration of the agent can be found (the agent policy).
- The enrolment token telling the Fleet server which policy to apply to the machine with the agent.
Step 5
Once Kibana indicates that one or more agents have been found, we are able to receive data from them. The best way to find out in which indices the data is stored is to search for the integration name in Index Management.
Step 6 – Troubleshooting
If no indices or data can be found in Elastic, follow these steps to see the logs of the Elastic Agent itself to check if it is reporting any errors or warnings:
- Check if log collection for the Elastic Agent itself has been enabled. In the settings of the applied agent policy, navigate to the Settings tab and check whether the box ‘Collect agent logs’ has been ticked.
- Once enabled, go back to Fleet, open the Agents tab, and check the status of the agent you have just installed. It should be healthy, indicated by a green box.
- Next, click on the agent from which you expect data. Click the Logs tab, and logs from the past 15 minutes should appear. Any misconfigurations or communication issues will be reported here.
- Request a diagnostics.zip file by opening the Diagnostics tab and clicking the button ‘Request diagnostics .zip’. This file contains the most detailed information about the status of the agent you can get from within Kibana, including logs and configurations.
That’s it for this blog. The next blog will delve into ingest pipelines, explaining how they can alter your data before ingestion, how they can be applied to data coming into Elastic from different data sources, and how they can replace processors defined in, for example, Logstash or Filebeat.
Need help with your Elastic challenges? Contact our experts.
With our 25+ Elastic certified consultants, Devoteam is your partner for developing and implementing Monitoring & Observability solutions that facilitate optimal IT control, from Business & IT Operations dashboards to centralized logging and proactive alerting.

