
Each week, a new “Do You Know” will be posted on our Elastic Technical Knowledge Hub to share useful knowledge to improve the observability using Elasticsearch. These topics originate from day-to-day challenges we solved for our clients. A stepwise description helps you to successfully implement solutions on improving the performance of your deployment and get the best monitoring of your applications using dashboards and alerting.
This week I will discuss: how to handle compressed files as part of pipeline setup.
Background
When setting up a Logstash pipeline to monitor a remote API, the input file is often in gz format, which is not directly readable. This article explores methods to set up a pipeline that retrieves this compressed file and sends the processed data to Elastic Cloud. This ensures efficient monitoring and analysis of remote API data by leveraging Elastic Cloud’s visualisation tools like Kibana.
Solution
There are two steps to achieve this. The first is to continually retrieve the API response in gz format every few minutes, and the second is to read this result and project it to our Elastic storage in the cloud.
While working on this problem, we noted that there were two main possibilities for retrieving the gz file.
Step 1 – option A
Set up a pipeline to retrieve the gz file. The pipeline input will use http_poller, and the output of this pipeline will be directed to a file.
input {
  # 1. Kick off with the login poll
  http_poller {
    urls => {
      login => {
        # Supports all options supported by ruby's Manticore HTTP client
        method => post
        url => "https://your_api_call.url"
        headers => {
          "Content-Type" => "application/x-www-form-urlencoded"
        }
        #To handle basic auth and also hide credentials, they were set to env. variables
        body => "username=${USER}&password=${PASSWORD}"
     }
    }
    cookies => false
    request_timeout => 120

    # Supports "cron", "every", "at" and "in" schedules by rufus scheduler
    # schedule => { cron => "* * * * * UTC"}
    schedule => { "every" => "120s"}
    #Before using below codec, ensure gzip_lines plugin for Logstash is installed
    codec => "gzip_lines"
  }
}
output {
  file {
    path => "/opt/elastic/logstash-data/app_folder_path/logfile.gz"
  }
}
Step 1 – option B
Alternatively, we can retrieve the file above using a simple cURL command. If you are unsure of the cURL command to use, set up your request in Postman and use the code feature to generate it for you.
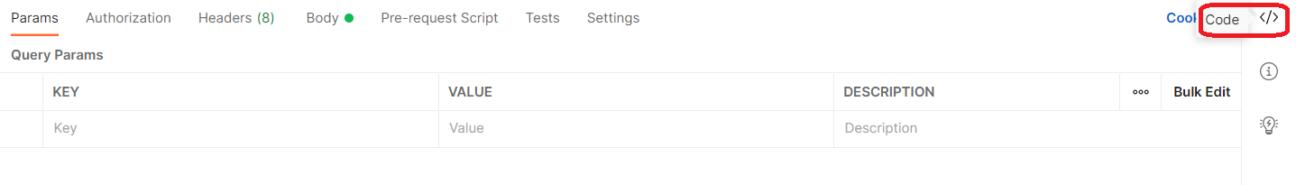
This cURL command can then be set up to run repeatedly using a crontab or scheduler.
Step 2
Now, read this file as input in the main Logstash pipeline. If the lines within the gz file are in JSON format, they can be sent directly to remote Elastic cloud storage as follows:
input {
    file {
        type => "gzip"
        path => "/opt/elastic/logstash-data/app_folder_path/logfile.gz" #path to GZ
        mode => "read"
        start_position => "beginning"
        codec => json #this is format of what's inside the gz; here it is JSON
        sincedb_path => "/opt/elastic/logstash-data/app_sincedb/gzip.db" #any path for sincedb
    }
}
output {
    stdout { codec => rubydebug }
    elasticsearch {
        hosts => ["https://cloud.url:9200"]
        # Below cacert path can be used if simply using hosts is throwing errors in connecting to host
        cacert => "/opt/elastic/root_cert_path/root-ca-cert-bundle.crt"
        user => "elastic"
        password => "changeme"
        index => "gzip-index"
    }
}
This article highlights how Elastic storage can easily read JSON log lines within compressed input files and can be easily visualised using Kibana. One example where this feature is useful is when dealing with API calls to MongoDB instances, which only return gz files.
Need help with your Elastic challenges? Contact our experts.
With our 25+ Elastic certified consultants, Devoteam is your partner for developing and implementing Monitoring & Observability solutions that facilitate optimal IT control, from Business & IT Operations dashboards to centralized logging and proactive alerting.

