
Each week, a new “Do You Know” will be posted on our Elastic Technical Knowledge Hub to share useful knowledge to improve the observability using Elasticsearch. These topics originate from day-to-day challenges we solved for our clients. A stepwise description helps you to successfully implement solutions on improving the performance of your deployment and get the best monitoring of your applications using dashboards and alerting.
This week I will discuss: how to create custom formulas in Kibana Lens visualisations.
Background
Sometimes, the predefined aggregations the Kibana Lens visualisation offers are just not enough to accomplish the metrics you actually want to show. Formulas in Lens offer you the ability to do much more complicated calculations than the standard aggregations can offer.
Solution
Step 1
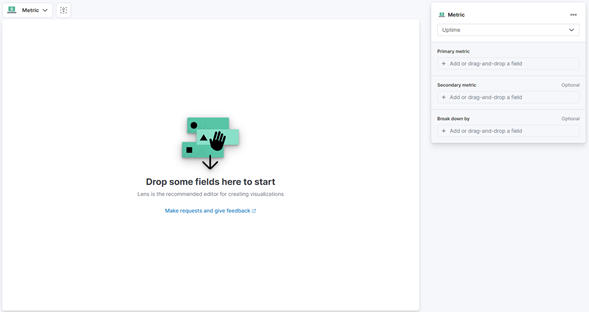
Create a new Lens visualisation using the Visualise Library or directly from a dashboard. In this example, we will use the metric visualisation as a starting point and the sample flight data as input.
Step 2
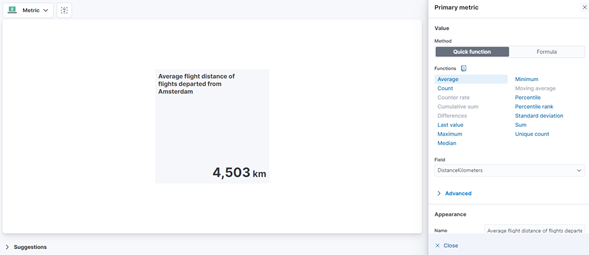
Add a primary metric. It can be helpful to use a quick function as a starting point to have a part of the formula already predefined by Elastic. In this example, we will choose the average distance in kilometres of flights departing from Amsterdam.
Step 3
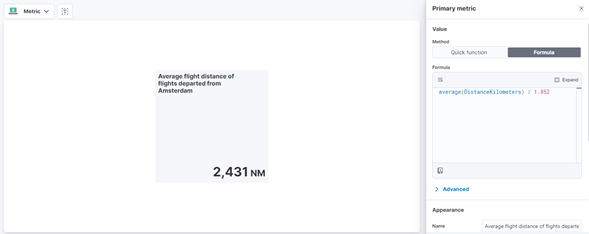
We now see the average distance in kilometres, but let’s say we want to see it in Nautical miles (NM) as that is the standard in aviation. To make this possible, follow these steps:
In the metric editor, click the ‘Formula’ tab. You will now see the current formula. To convert kilometres to NM, we have to divide it by 1,852. The formula would be:
average(DistanceKilometers) / 1,852If you should have to multiply, simply use * instead of /.
Step 4A
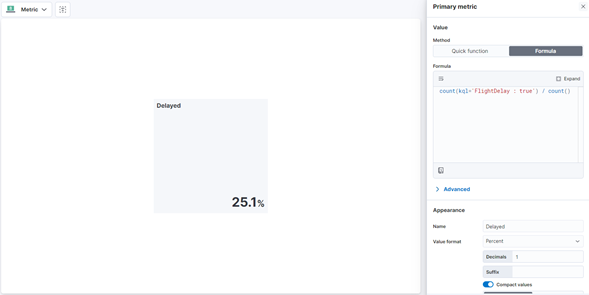
Pretty simple, right? Let’s make a slightly more complicated formula. Let’s say we want to see the percentage of delayed and non-delayed flights. To calculate this, we need to divide the number of delayed flights by the total number of flights. The nice thing is, we can use KQL in formulas! The formula to calculate this percentage would look like the following:
count(kql='FlightDelay : true') / count()In this formula, we first select all flights that have the field ‘FlightDelay’ set to true. We enter this KQL directly within the brackets of the aggregation. More on this later. Next, we divide that number by all available documents to calculate the percentage of delayed flights.
Tip: Set the value format to Percent to get the actual percentage instead of the raw outcome of the calculation.
Step 4B
When using the count function, no field has to be selected as all the documents will be counted. So, how do you use KQL when using an aggregation? Within the brackets, type a comma after the field used and start typing your KQL, as shown in this example:
average(FlightDelayMin, kql='FlightDelayType : "Weather Delay" ')Step 5
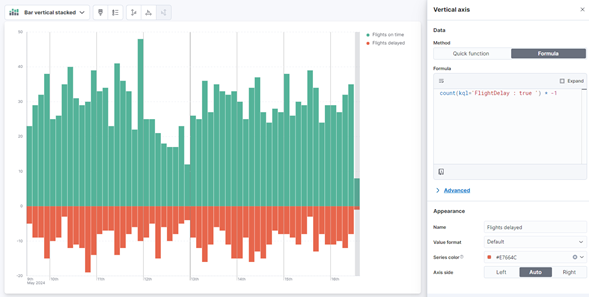
Let’s use a combination of KQL and a formula to create a divergent bar chart showing delayed flights compared to on-time flights. Create a bar chart with two metrics. Use the following formula for flights with no delay:
count(kql='FlightDelay : false ')And use the following formula to show the flights with delays, inverted to the others:
count(kql='FlightDelay : true ') * -1Colour the non-delayed metric green and the delayed one red to get the following graph:
Step 6
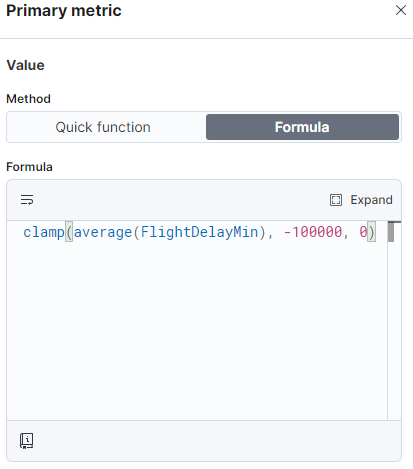
Let’s create one final formula for this blog using one of the math functions available in the formulas. We will use the clamp function for this example. Clamp is a function which ensures that only values in a range you specify are returned. The syntax is as follows:
clamp(value, min, max)Let’s say flights leaving earlier would also be recorded in the FlightDelayMin. In the event a flight takes off earlier, the delay would be a negative number, but negative values have a positive meaning in this field. We could use the following formulas in two separate metrics and give them their own series colour.
Flor flights leaving earlier
clamp(average(FlightDelayMin), -100000, 0)For flights leaving later
clamp(average(FlightDelayMin), 0, 100000)Here we are instructing Elastic to group flights with a delay between -100000 and 0 minutes as leaving earlier. The other metric groups all flights departing later than planned.
Tip: Elastic offers a formula reference in the Lens editor to view all available functions and how to implement them. Click the book icon in the bottom left corner of the formula editor to open it.
Need help with your Elastic challenges? Contact our experts.
With our 25+ Elastic certified consultants, Devoteam is your partner for developing and implementing Monitoring & Observability solutions that facilitate optimal IT control, from Business & IT Operations dashboards to centralized logging and proactive alerting.

