
Many organizations are using Elastic tools with Logstash in their processes to feed and transform data into the Elasticsearch Database. Logstash is a tool that allows the manipulation of your data. This includes operations like filtering, renaming, or dropping certain field values in the log and subsequently sending the data to indices.
Logstash is a great tool that allows you to use a large variety of manipulations, however, the downside is that Logstash is not running in the cloud and can be seen as a single point of failure. Logstash can be made high-available by adding a buffering component like Kafka, but this means extra complexity and extra costs.
The ingest pipeline
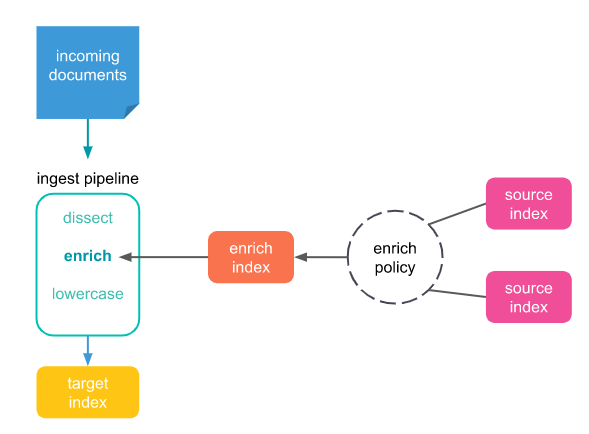
Elastic is offering a strong alternative to Logstash: the ingest pipeline. Data is sent via a Post API, directly into Elasticsearch. Manipulations of the data can be performed using a large number of Processors. Transformations can be performed, such as renaming fields, setting conditions before certain processors become active, and enriching your index with data from other indices.
This last function is what we discuss here since we often face the necessity to enrich data from one log to another. Below is a schematic visualization of the data enrichment process.
How to set up the enrich tool using an example
We monitor the front-end and back-end calls generated by clients that are using a web portal. Information on the account number is generated in both the request-in and response-out calls. The client information is not included in the error log should any error occur in this process. To overcome this, we use the enrichment processor to add the client’s account number to the error log. To do so, we must first create an enriching policy.
The enrich policy must include the indices, a match_field, and the enrich_fields. In this example the index name is webportalcalls, match_field is the business Transaction-id and the enrich field is the account number. The match field is used to map the account number from either the request-in or response-out into the error log.
In the Dev tool in Kibana the following PUT command must be executed to create the enrich policy:
PUT /_enrich/policy/webportalcalls-policy (given policy name)
{
“match”: {
“indices”: “webportalcalls”,
“match_field”: “businesstransactionId”,
“enrich_fields”: [“accountnumber”]
}
}
The next step is to execute the enrich policy:
POST /_enrich/policy/webportalcalls-policy/_execute
Before we get the account number details in the error log, we must adjust the ingest pipeline:
PUT /_ingest/pipeline/webportalcallspipeline (so the pipeline name is webportalcallspipeline)
{
“processors” : [
{
“enrich” : {
“if”: “ctx.severity == ‘error'”,
“description”: “Add ‘accountnumber’ data based on ‘businessTransactionId’ and severity: error”,
“policy_name”: “webportalcalls-policy”,
“field” : “businessTransactionId”,
“target_field”: “accountnumber”,
“max_matches”: “1” }
}
]
}
After this, set up all logs with severity: the error from the webportalcalls index will contain the account number, sharing a common business Transaction-id.
Please note that in this example the enrich policy is coming from the same incoming documents. In other cases, the enrich-policy might come from another index in Elasticsearch.
Summary: transform your Logstash setup into ingesting pipelines with the enrich processor
If you started using Elastic after 2020, you probably started with ingest pipelines straight away. Maybe this article will help you to get more out of the ingest pipelines. For the long-time Elastic users from before 2020: take a look at the investment you have to make to transform your Logstash setup into ingesting pipelines with the enrich processor. The most likely benefits are:
- Improved reliability
- Better availability
- Faster data ingestion
- Reduced complexity
- Future proof setup (Elastic Roadmap)
- Easier to integrate your Monitoring-as-Code using CI/CD
Our Elastic team
With our 15+ Elastic certified consultants, Devoteam is your partner for developing and implementing monitoring & observability solutions that facilitate optimal IT control, from Business & IT Operations dashboards to centralized logging & proactive alerting.

