On November 13th, 2018, TIBCO unveiled the new version of Spotfire, Spotfire X (but I learned to pronounce this as Spotfire 10). And there is quite a bit to tell about this new version!
To start with, the experienced user has to get used to the new interface. At first I wondered why this complete overhaul, but soon realized that it is now very much in line with the on line version, Spotfire Business Author. It took me some time to get used to it though.
Improved Data Wrangling
But let’s look at the real innovations. Spotfire X has further improved its data wrangling possibilities. In the previous versions it had already made some significant improvements on editing the data sources and transformations. This has now been sort of completed; it is possible to change the structure and build of you data on the data canvas.

For an experienced user, who does a lot of joins, appends and transformations, this really again is a step forward. Very nice AI features have been added that recognize the structure of your data, suggesting to append similar looking tables, and joining tables.
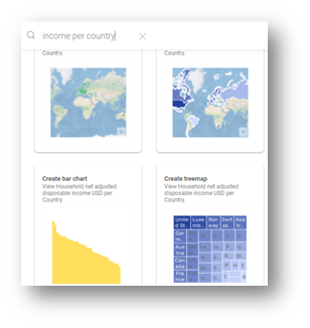
Sportfire X: Natural Language Search
And then there is this Natural Language Search. In the quest for self service BI Spotfire had already something called the Recommendations Engine. Now this feature is enhanced by adding a natural language search. So instead of clicking on the columns you want to use you can now simply type in things like: “Show me the income per country”, and Spotfire will come up with graphs that might be of use for you.
Again, I think this is first and for all interesting for the less experienced users and for self service BI, but it is a nice want-to-have thing that a mature analytics environment should really have. By the way, it does not only suggest visuals, but when you ask for “Clustering”, for example, it will also suggest built in statistical experiences.
Connect to Streaming Data Sources
But the greatest news (for me at least) is the ability to connect to streaming data sources. It was already possible to do something in conjunction with TIBCO Streaming (aka Streambase) but now Spotfire has native connections to 50+ streaming sources including Kafka, EMS, JMS, Apaches (HDFS, HBase, Cassandra, Kudu), IBM MQ, MQTT, RabitMQ, Salesforce Streaming, WITS, OsiPi, Change Data Capture, and many Capital Market Exchanges.Connect it and you will see your graphs come alive in Spotfire. And more exciting even, it is possible to join this moving data with your data at rest. A real cool feature there!
Although these are real nice features Spotfire as an isolated analytics tool is powerful, but comparable to other tools in the market. Where TIBCO makes the difference is that their stack of Analytical products ties in so easily. Combined with their statistical tools, Spotfire Data Science and/or Statistica, with TIBCO Data Virtualization and Streaming the possibilities are sheer endless. And then Spotfire will be your end point in a chain of analyses, tying it all together.
More about our TIBCO Spotfire Knowledge
Want to learn more about Spotfire through our client use cases, handy how-to articles and blog-posts? Click the button below to discover our knowledge.

