

Have you wondered what activities are conducted every day in your Databricks workspaces? Do you want to monitor the cost and performance for each Databricks cluster and job? Do you want to make improvements and potentially save cost on Databricks workflows? If yes, this article might be interesting for you! In this article, we introduce Overwatch to you, a monitoring tool developed by Databricks Labs, which is meant to help their customers to get deeper insights into the activities in Databricks.
How does Overwatch work?
Overwatch collects diagnostic data through Event Hub delivery via Azure Diagnostic Logging. In the meantime, it collects and stores compute logs directly in a Storage Account (in an Azure environment). Then an Overwatch job in Databricks workspace reads the data from EventHub and Storage Account, and creates a database from the collected data. The database is established following the bronze-silver-gold architecture, and a user-faced database is built on top of the gold layer. Users can then query from this database with cleaned data to perform analysis.
The deployment process of Overwatch can be found here on their official website. It is worth mentioning that Overwatch also provides a flexible structure for deployment in multi-workspaces. Users can choose to deploy Overwatch for multiple workspaces with one Databricks job or separate jobs. The information collected by different jobs can be accessed from one central database, so there is no need to manage multiple databases for different workspaces (unless that is what you want).
What can we do with Overwatch?
The information generated by Overwatch can be used to determine and justify the cost, utilization, efficiency, and workloads within the workspaces. Users can use this information to make better decisions and improvements.
Here are some metrics we can create as examples:
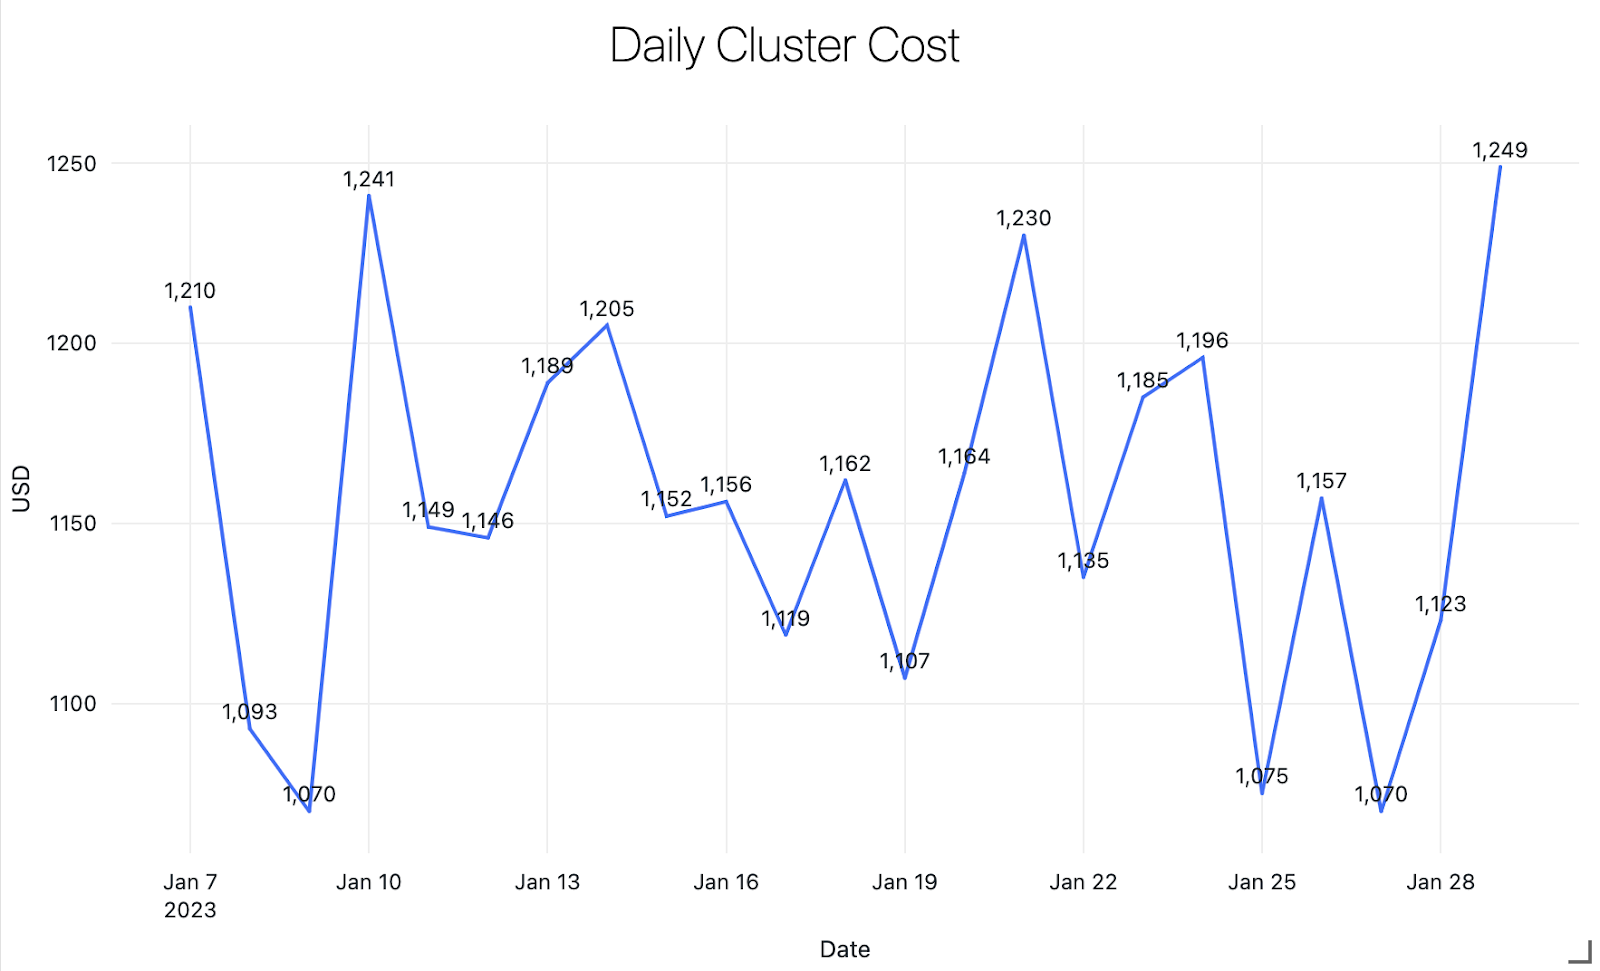
- Daily cost:
With Overwatch, we can monitor the daily cost of all clusters/jobs in the workspaces and get an overview of the total spending on Databricks. It is also possible to check separately the total DBU/compute/driver/worker cost, as well as these costs of jobs. The following chart is an example of the daily cost of all clusters in the workspaces.
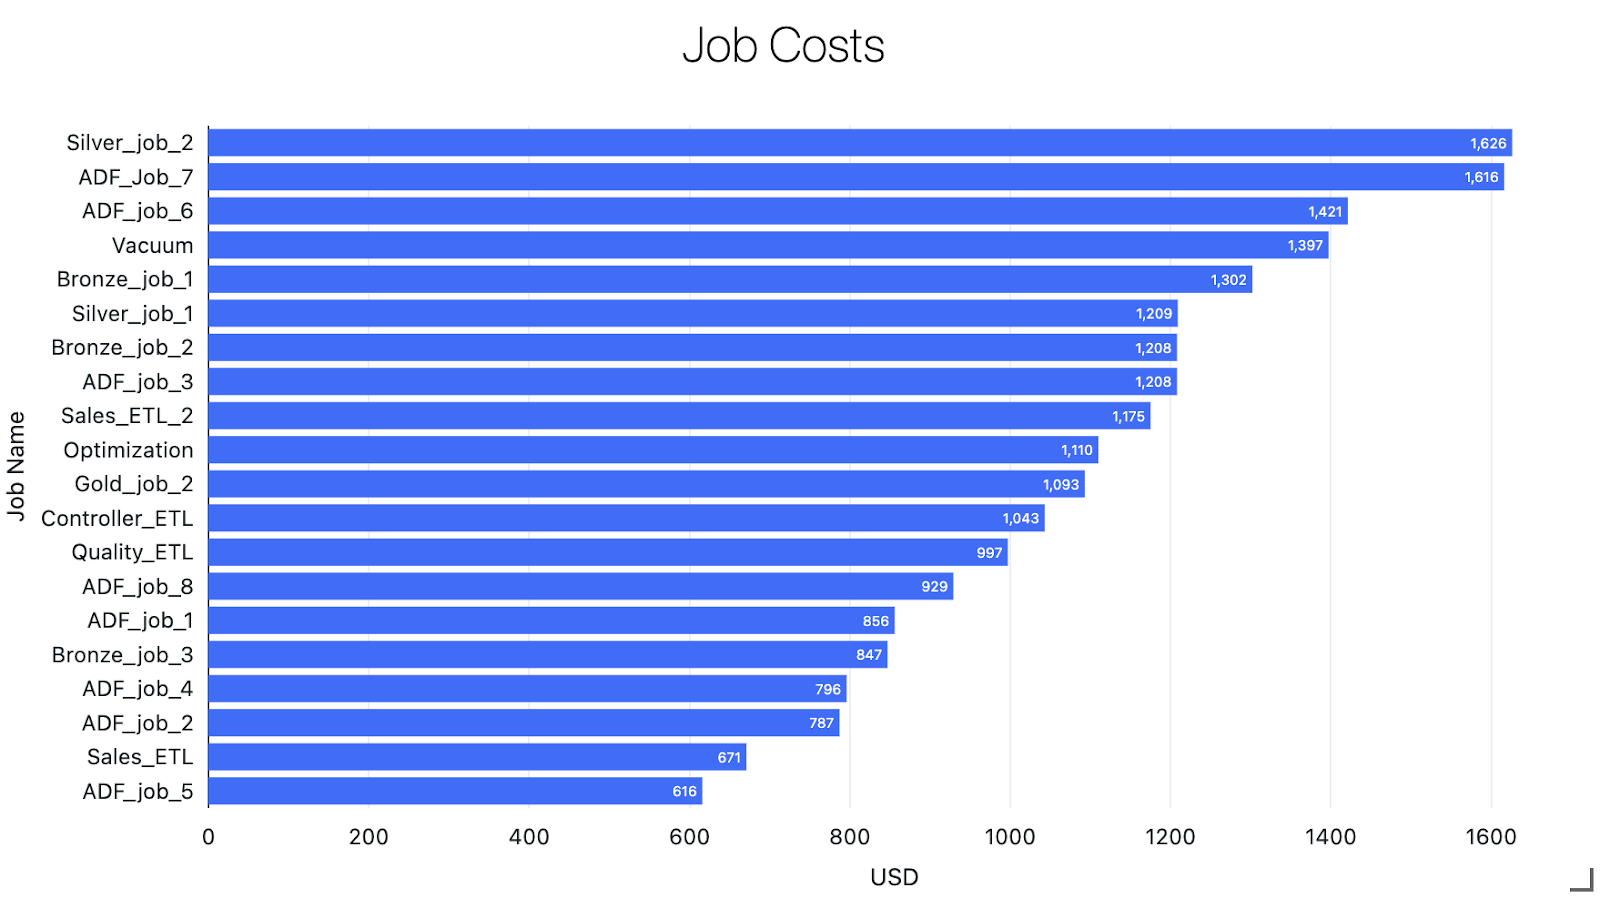
- Cost per job/cluster:
We can calculate the cost per job/cluster using data collected by Overwatch. With this information, we are able to understand which jobs/clusters are the most expensive and focus more on making improvements on them. The following chart shows an example of listing the most expensive 20 jobs in the workspaces.
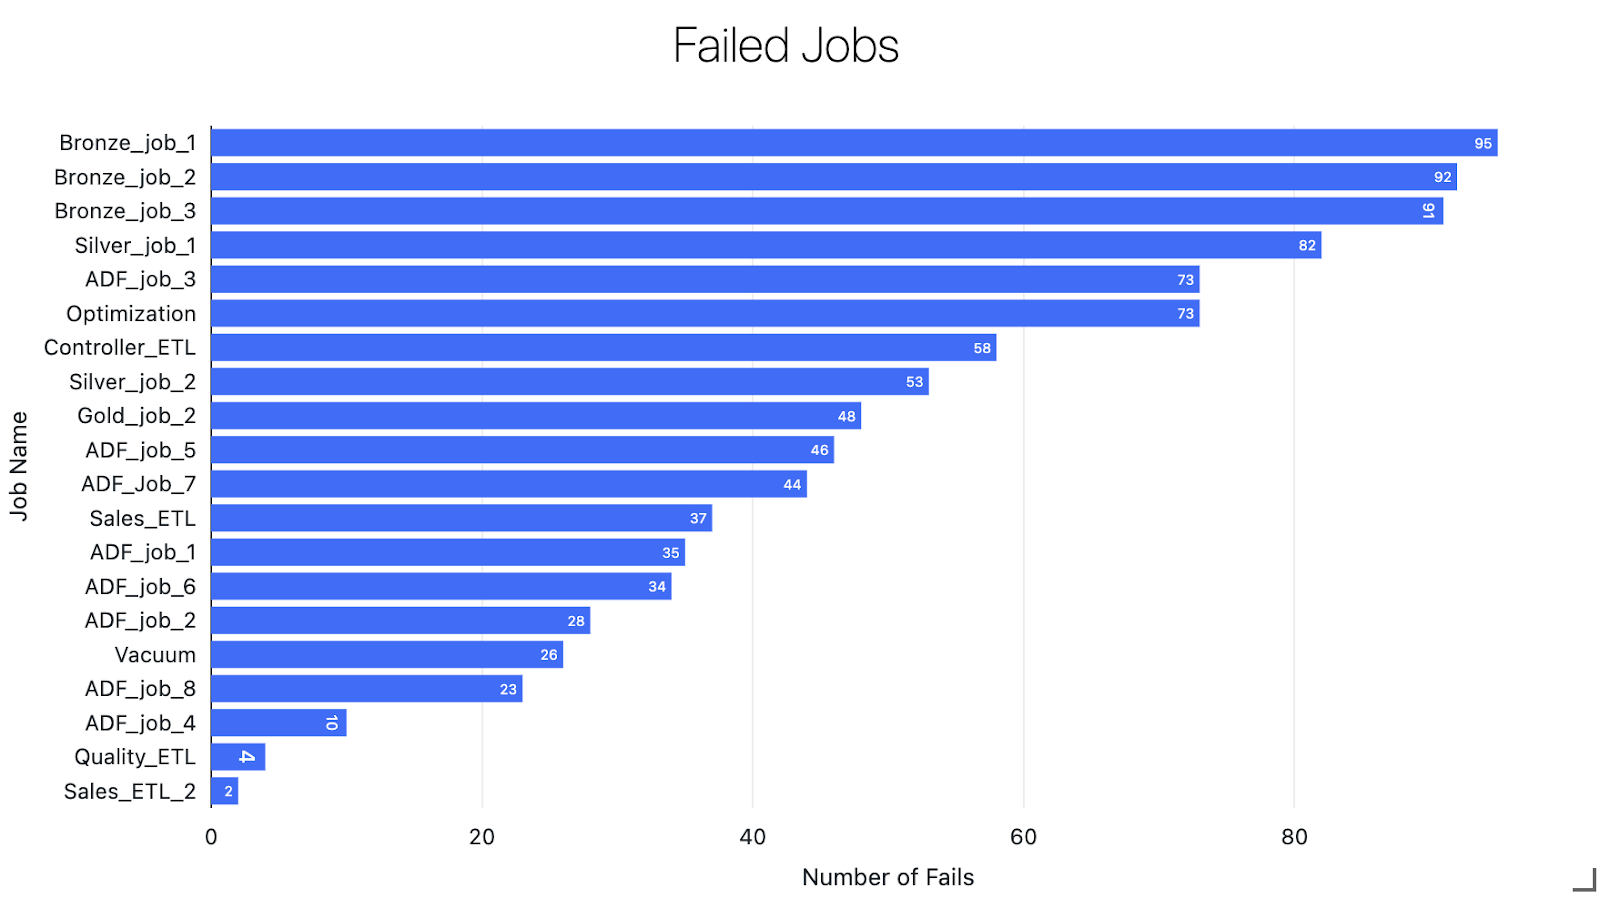
- Job performance:
To monitor job performance, we can calculate metrics such as failed time and runtime of jobs. Based on requirements, we can decide if it is necessary to investigate the jobs that rank on top of the list. The following chart shows an example of jobs that failed the most times.
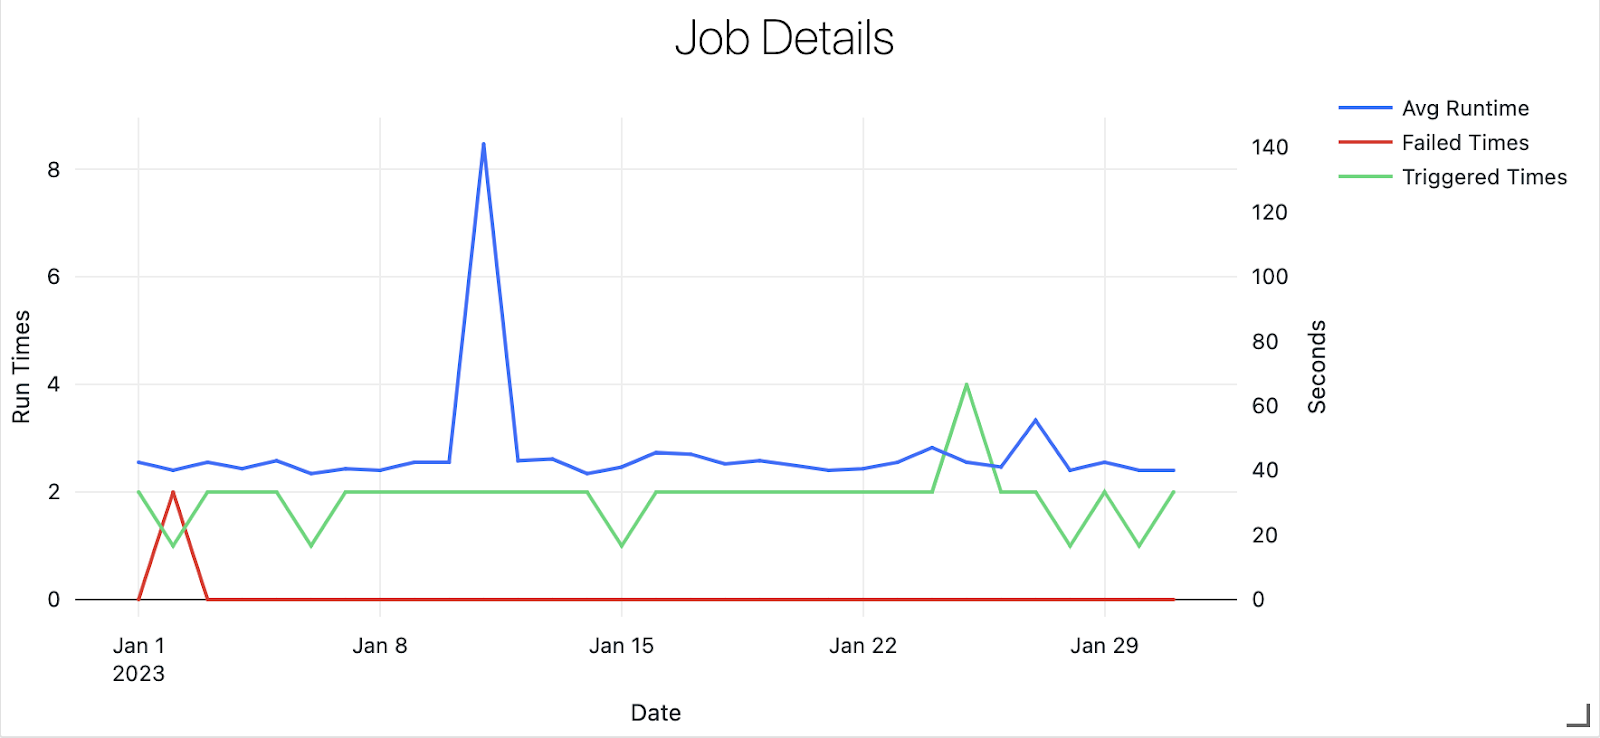
- Performance of a specific job:
Overwatch can also be used to monitor individual jobs. It allows us to compare the performance of the job with its history, and to immediately spot any irregularity. The following chart shows the average runtime of the job, how many times the tasks in the job failed and how many times the tasks in the job were triggered in the past month.
- Configuration of clusters:
We can also use Overwatch to get the configuration of clusters/jobs all at once, which will be helpful for managing the clusters/jobs collectively. For example, the following table shows the Databricks Runtime version of each cluster. It brings the awareness of which clusters are still using outdated DBR.

- Other metrics:
It is possible to perform other customized analysis with Overwatch, such as user activities, notebook activities, query history in Databricks SQL workspace, and spark activities for deeper analysis.
Overwatch provides great potential in monitoring Databricks
All in all, Overwatch opens the black box of the underlying activities within Databricks workspaces. By learning more about what happens within jobs, clusters and other activities, users can capture more opportunities to improve the performance of their workflow and potentially save cost. Devoteam can provide an expert view on how Overwatch can help your organization and assist you in implementing them. If you are interested, please reach out to us!

