Now that we have created the dashboard, we also want to add a sample visualization to our dashboard. A visualization project can be created from the “New” menu under homepage (Screen 44). This will move us out of Classic Home, to Oracle’s web based Data Visualization tool.
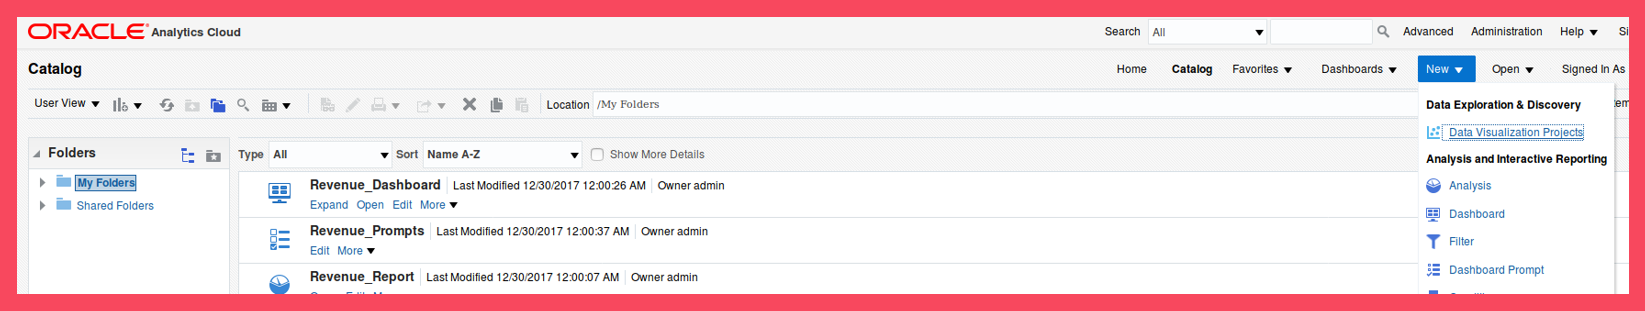
Screen 44
First we need to choose the connection which holds the data we need (Screen 45).
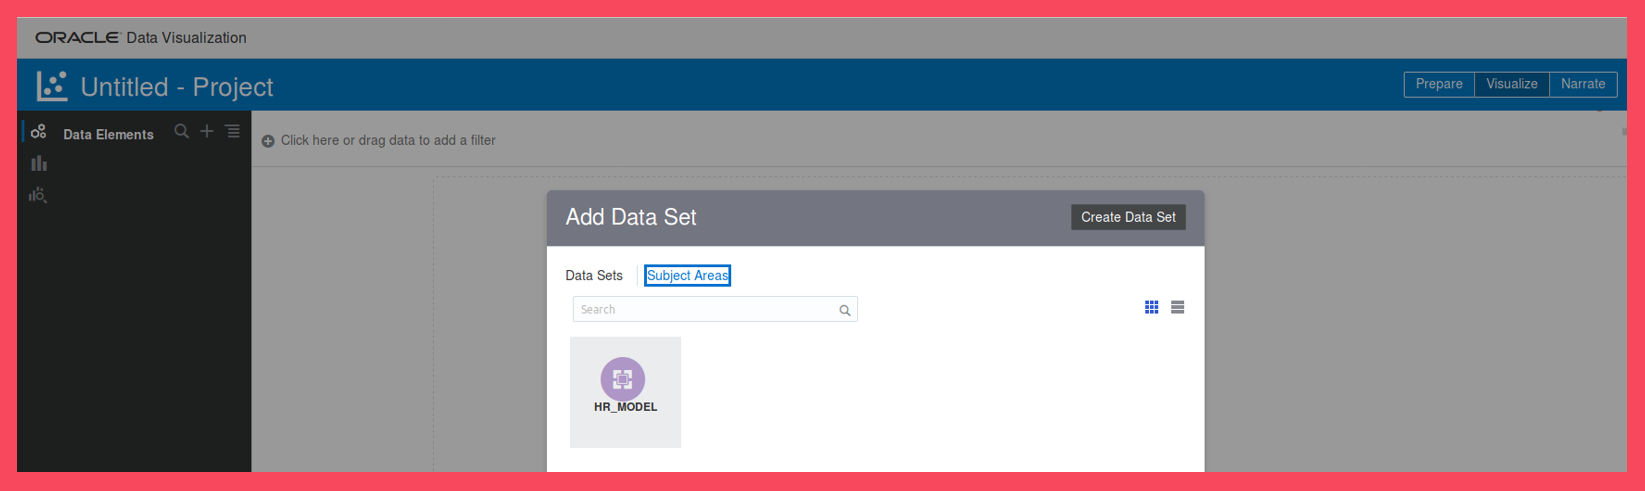
Screen 45
The facts and dimensions in the model are listed in the left pane (Screen 46).
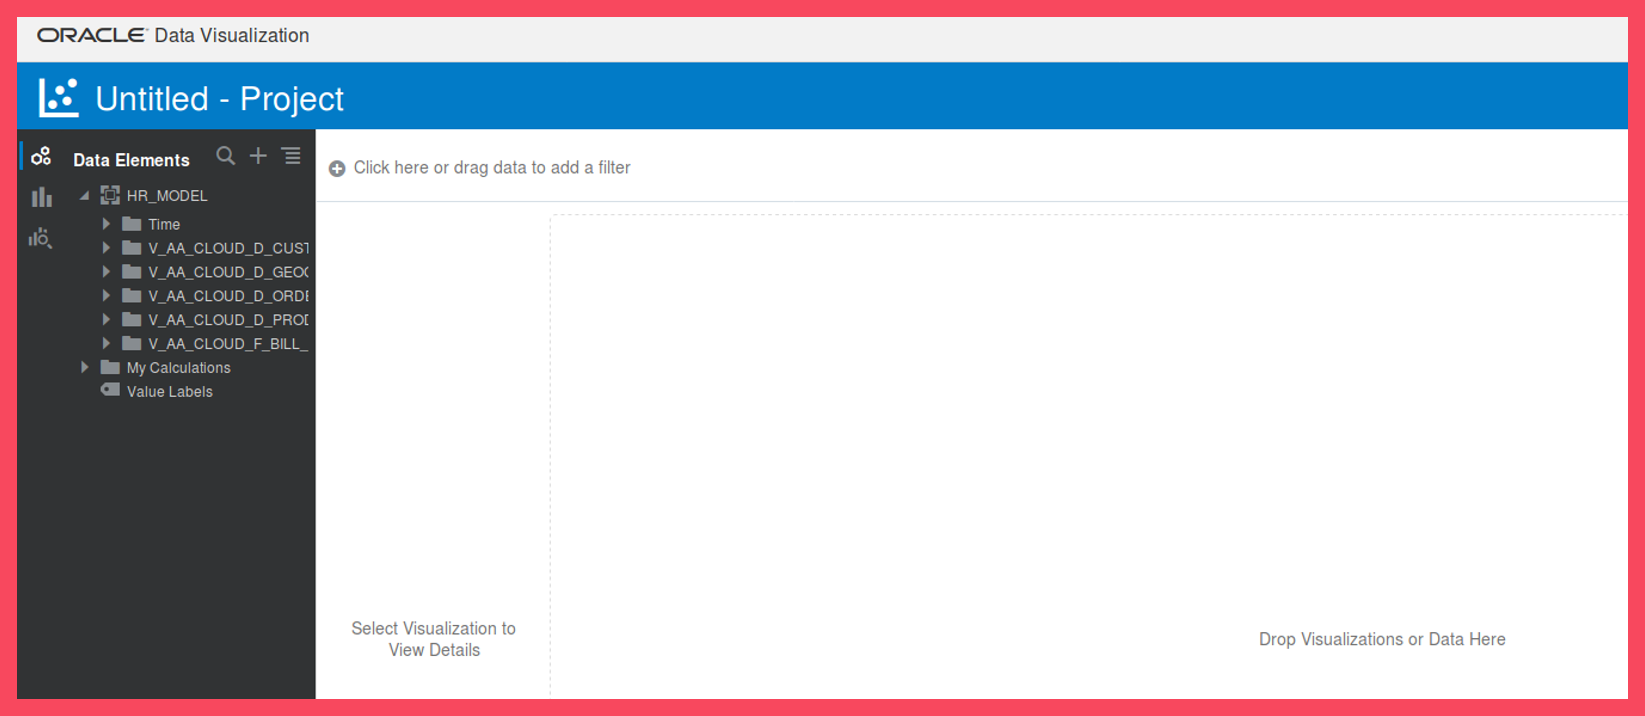
Screen 46
Drag and drop Revenue column to the Values section (Screen 47).
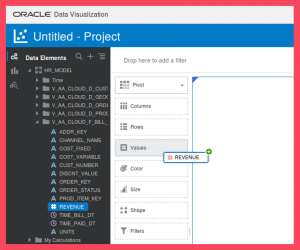
Screen 47
Let’s add the Order Status to show up as Columns (Screen 48).
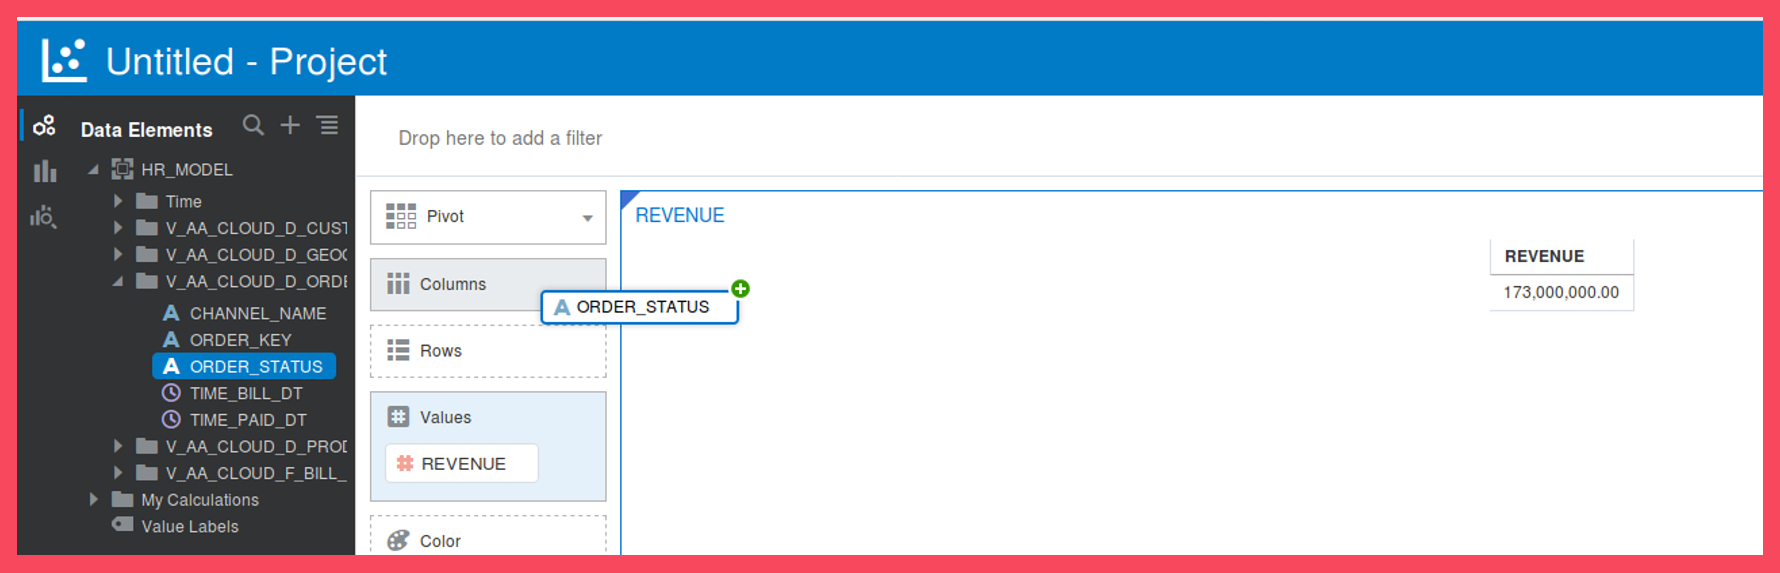
Screen 48
Finally, add Calendar Year as a Row (Screen 49).
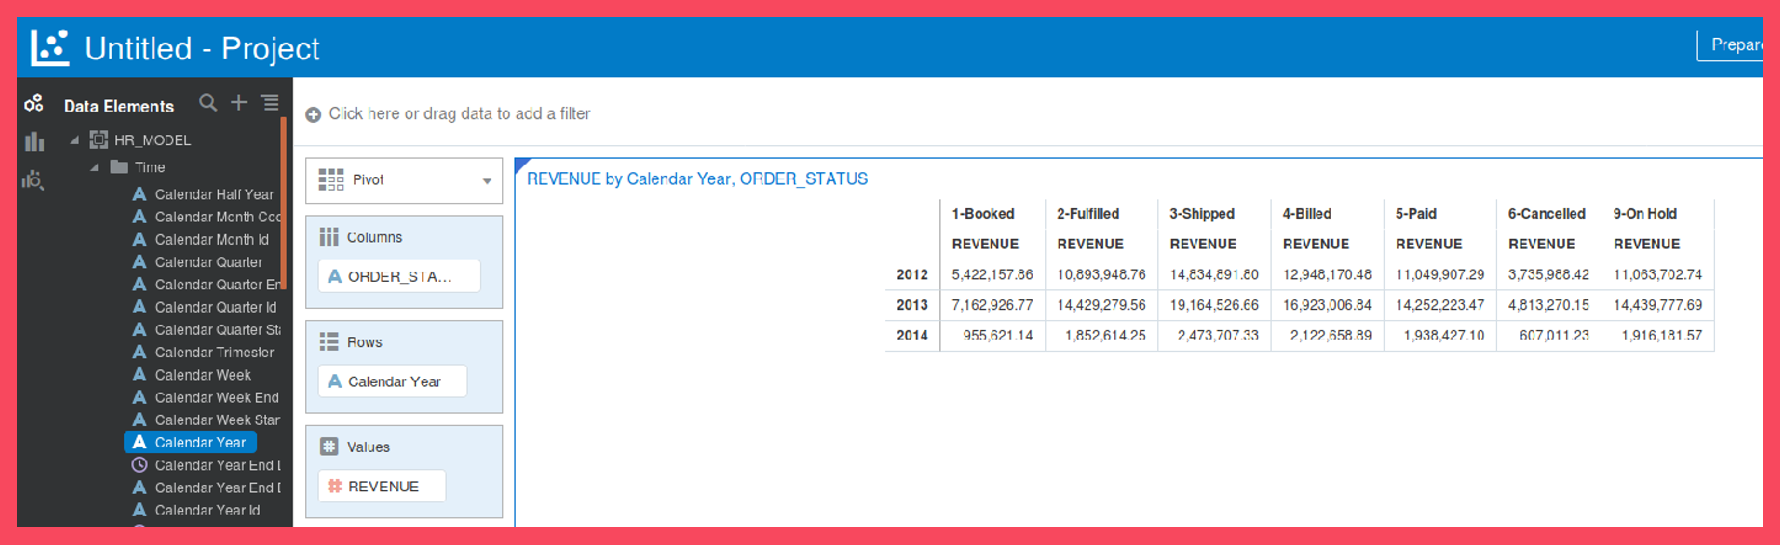
Screen 49
Save the visualization as v1_pivot.
Now, let’s change the visualization from PIVOT to RADAR BAR (Screen 50). Save this new version as v2_radar_bar.
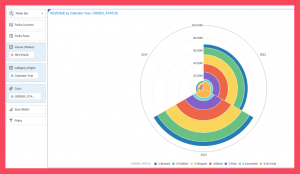 Screen 50
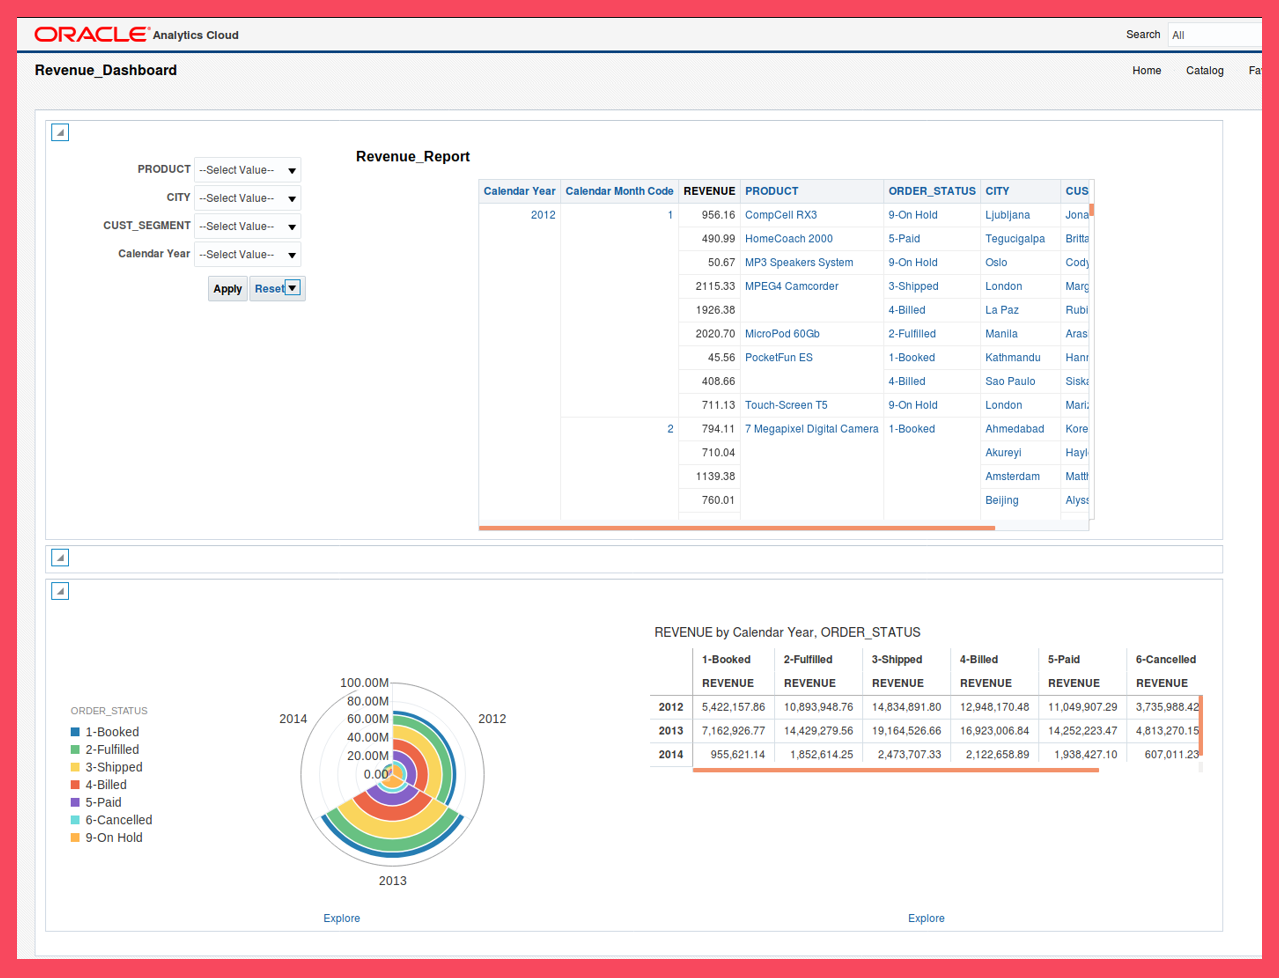
Let’s add both visualizations to our dashboard. Below you’ll find our final result (Screen 51).
And this marks the end of our step-by-step guide for Oracle Analytics Cloud. Please feel free to contact me for any questions via the contact section below.
Data & Analytics insight and visualization for your organization?
We at Devoteam are a premium high tech company. At Devoteam, we deliver innovative technology consulting for business, with 5,200 professionals dedicated to ensure that our clients win their digital battles with our ability to define & run transformation and change programs, based on providing technology expertise and complemented with selected topics to go all the way to implement cloud based solutions.
Our main Data & Analytics mission is to help your organization in getting high quality insight from your data to boost data-driven decision making. We can assist you with:
- Implementing a data governance & data quality virtuous cycle, which is in line with data privacy requirements and business drivers
- Defining and implementing the process & components needed to provide fast access to data, in multiple formats, to multiple users
- Use analytics & visualization to help businesses understand their situation and take the right decisions

