Wednesday October 31st I joined the New Relic Futurestack18 conference Amsterdam: This intensive and informative day was filled with Keynotes, product demonstrations and customer case studies. With good coffee and breakfast provided at the Andaz Hotel in Amsterdam, the day was off to a good start.
The platform for modern teams
Ramon Guiu, Senior Director Product Management at New Relic, kicked off with the keynote: The platform for modern teams. “What is the status of this feature” or “what is the status of this bug fix” is what they call Velocity Imperative at New Relic. The increasing speed of changes is a topic known to all, and it is happening so fast that it is very difficult to track these changes or see what the effect of certain changes is. This, in fact, is digital transformation. Examples are shown everywhere: pre-ordering your coffee and just picking it up when you arrive at the shop, skipping the queue, or paying for fuel with an app (Shell). New Relic has 17.000 customers in Europe alone and 50% of the Fortune 500 companies.
The numbers are very interesting: By 2021 at least 50% of the global GDP (Gross Domestic Product) will be digitized, as forecasted by IDC, the global provider of market intelligence.
New Relic customers have been able to use the monitoring platform, API or Agent based, to increase conversion rates, bug detection, incidents before production, and reducing error ratios. In short, monitoring is key. In Dutch there is a saying: ‘Meten is weten’, ‘measuring is knowing’. More globally translated: Seeing is believing.
The demand from business to support the velocity of speed can be translated to immediate value. This cannot be delivered through traditional methods anymore, and is moving towards cloud adoption and Agile DevOps with the focus on digital customer experience. This is critical when driving revenue through digital channels.
End User Experience, Applications, Infrastructure and Business
To continuously release business value, the best way is to instrument everything. The 4 key pillars of instrumenting are End User Experience, Applications, Infrastructure and Business.
Instrument the infrastructure and make sure applications have the right amount of resources dedicated to them. You instrument the applications to ensure the key business logic that drives user experience is working correctly. Instrument the end user experience as well so that you can measure exactly what the customers are seeing, right out of the browser or in a mobile application. Also instrument the business as well so that you don’t accidentally make logic changes that break the business.
Customers from New Relic are generating 2 million events and metrics per minute, 5 million pages views, 50 million unique containers per month and 400K+ software developers deploying every day.
Now as mentioned earlier, monitoring is key. Especially combining metrics and logic is a very powerful way to drive improvements. Real time insights to innovate faster is what the New Relic platform offers.
This all very much hooked into the talk from Neil Macgowan, the Director of digital intelligence at New Relic. His talk was mainly about “The secrets of high performing modern software teams, and DevOps without measurement is a fail”.
The DevOps Handbook
It’s funny, also in my previous blog about Devoteam’s Knowledge Information Sharing Session on Kubernetes, I wrote how my knowledge from the DevOps introduction training proved useful.
By that time I had not yet finished reading the novel “The Phoenix Project” by Gene Kim and Kevin Behr (also the co-writers of the DevOps Handbook).
The good stuff that Neil pointed out was coming from the DevOps Handbook:
- Speed and agility will determine whether you win or lose
- DevOps are high performers
- The waterfall method meant: You didn’t go into production without QA
- And DevOps means: You don’t go into production without instrumentation
This relates to the earlier discussed topic ‘measuring is knowing’.
Case Studies: Lego and Maxeda DIY
Lego – Brick by brick
Time for Brick by Brick, A Lego Group case study by Simon Young, Senior Engineering Manager from Lego Group. Simon Young unfortunately could not make it to Amsterdam in time, but the organization had this covered: They quickly popped up a YouTube video coverage of Simon’s presentation. The presentation was funny and understandable. Watch the full “brick by brick” video here if you are interested.
To celebrate that the Lego Group was founded 85 years ago, in 1932, they build the biggest Lego set since then: the Millennium Falcon, made of 7,541 pieces.
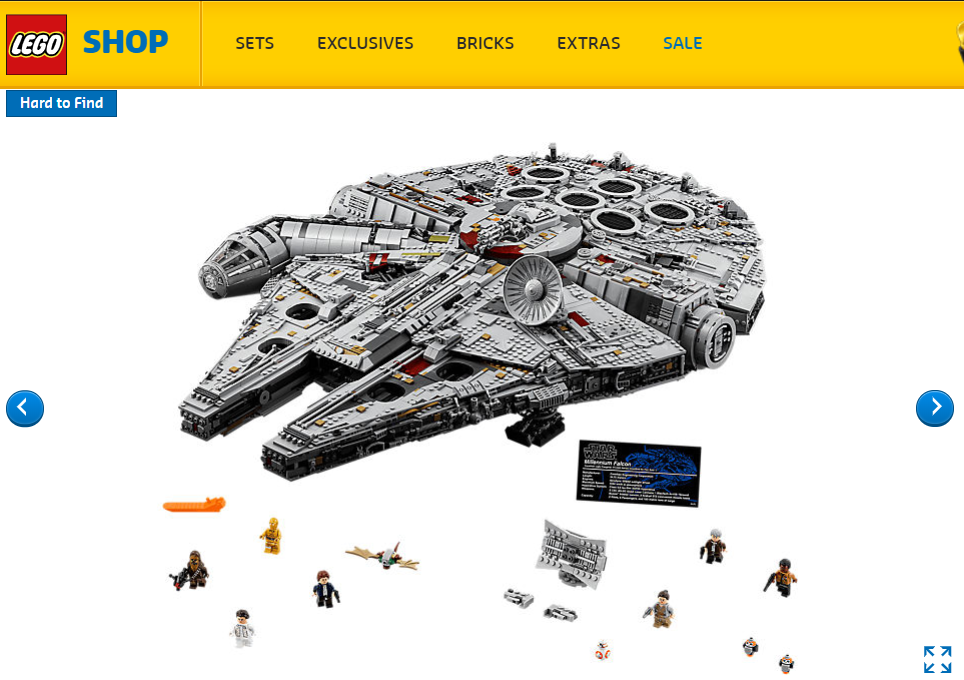
Lego teams were preparing to make the Millennium Falcon available for sale to customers around the world on September 14th 2017.
The teams were all ready for the timed launch, but they didn’t know when the load would come, and with their monitoring system at the time they had minimal observability of their front-end JavaScript applications and they had zero visibility of how their application was running on a client browser. They had to work with the tools they had. As you can imagine not everything went entirely as planned. Within 20 seconds of the set going live the server loads were rising on all different applications in the platform. Response time when adding to cart, getting to the checkout and the attempts to purchase were slowing down by the second. Databases were filling up and at some point it was impossible to make a purchase. They had no choice but to the hit the panic button, not an actual Lego panic button though. They didn’t know what happened and finding the right data was just taking too long. So they needed to restart the Java applications which took a long time. By that time the traffic had already decreased and the web shop stayed up. In the end they sold the Falcon sets, but were not able to provide the customer experience that they built.
This experience led Lego Group to re-architect the whole platform the web shop was running on. Their focus was on building the best, most reliable Lego shopping experience available anywhere. After the Millennium Falcon launch they knew they needed a much better way of monitoring for the existing and the new platform.
The main reason for the Lego Group to choose New Relic was to gain observability.
Key benefits of implementing New Relic, that are important to Lego:
- Visualizing performance, ability to quickly create a dashboard for an specific event
- Ability to see live performance is critical, by having the dashboards they don’t have to panic or roll back software. Quickly look, understand and make the relevant changes.
- Dashboards are great for team culture, supporting DevOps en SRE mindsets.
Encouraging to connect, not just on the code they work on, but also to be clear about what the code is going in production. - Insight into more relevant application metrics. “It was like flipping a light switch” to see things like garbage collection, node memory in real time. This data is priceless when you are running a high revenue platform for any business.
- Turning data and metrics into something you can act on.
Maxeda DIY
Another customer case study was from Arjan Franzen, Development Lead at the Maxeda DIY group. Maxeda might not be a very familiar name but you’ll surely know the brands it represents: Praxis and Formido in the Netherlands, and Plan-it and Brico in Belgium. The aim for Maxeda was to implement a new web platform and improve their NPS (net promoter score). So basically knowing and improving their customers experience. They were already using a scalable solution via Amazon Cloud, containerized microservices as new technology architecture, and new processes by using local and remote teams in a LeSS fashion. But they were lacking the monitoring insights to see if their transformation attempts were actually working. New Relic was the helping hand.
How Maxeda started using New Relic is basically how I see the growth of using monitoring tools. Somebody in Operations sees something better and decides to use it. The more people use it the bigger the support and dependencies become.
For Maxeda, insight in performance and user experience both became clear when they started using the New Relic APM, Browser, and Synthetics. In the Insights module they were able to see which critical services were running and if the number of running services matched the desired number. In the presented case the store finder process was not running. Luckily for them this occurred in the middle of the night when most Dutch people were sleeping and not looking for a DIY store. The example is not one with a lot of damage, but it is a clear message. Imagine this happening to critical services when a new product has just launched and customers literally jump your website all at the same time. Monitoring and putting alerts on certain events is the way to be in front of catastrophes.
To conclude
Visiting Futurestack18 made me (again) realize all the information and insights that monitoring is key for, not just Operations departments and Monitoring departments, but also Developers who are able to see how their code is working and have the ability to intervene before it’s too late. Business departments like Sales and Marketing help the Developers focus on what the customer wants, and give insight in the contribution of changes to revenue and customer experience.
The day was closed off with drinks, some delicious finger food, and the chance to talk to the presenters of the customer case studies, other visitors, and of course New Relic itself.

