On Tuesday the 29th of October, a group of Devoteam consultants visited Elastic’s yearly “Elastic on Tour” event in The EYE Filmmuseum in Amsterdam. Elastic is from origin a Dutch IT “Search” company that builds self-managed and SaaS offerings for Search, Logging, Security, and Analytics use cases.
The company develops the open source Elastic Stack (Elasticsearch, Kibana, Beats, and Logstash) previously known as ELK Stack, free and paid proprietary features (previously X-Pack), Elastic Cloud and Elastic Cloud Enterprise. They offer solutions with which you can put large sets of data in one database through which you can search swiftly.
There were multiple sessions, announcements and product updates during the day. There was also an “Ask Me Anything-Booth” where guests could ask all kinds of technical questions.
Top 3 Takeaways
Takeaway #1: Elastic Stack
Elastic acquired Endgame, a data security company, in order to improve its software services in Elastic Stack. “Empower your security practitioners with Elastic Stack” was the big news of the day. With the integration of Endgame into Elastic, they are taking big steps towards further facilitating the use of their services. Users can now more easily detect and isolate security threats. In IT there are more security jobs than staff applying for these jobs. Luckily, the integration of Elastic Stack and Endgame enables users to keep malignant attacks away from their organizations more easily, therefore staff can be coached to efficiently handle the security software.
Takeaway #2: Roadmap of Kibana
In a Keynote, the future of Kibana was being discussed. Kibana is an inherent part of Elastic, which allows users to visualize all the Elasticsearch data and navigate the Elastic Stack so they can do anything from tracking query load to understanding the way requests flow through their apps. What was so notable in the Roadmap, was the increased user-friendliness, more integration of Logstash and Beats Configuration within Kibana, so; more practicality in more possibilities and functionality. Through the integration of Beats and Logstash with Kibana, the functionality increases with, for example, graphical representation of data on maps. More users can now easily manage everything from the Kibana Dashboard.
Takeaway #3: Observability
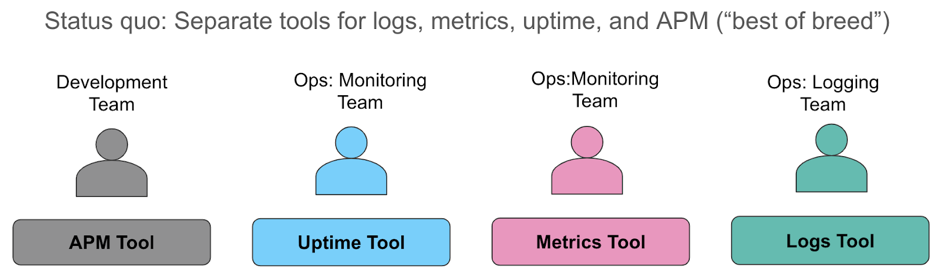
Originally being a search company, nowadays Elastic is mostly being used for other services such as Observability. Observability is being able to see what happens in your (IT) organization at a glance, even though the software has become more complex. The three pillars of Observability are Metrics, Logs and Application Traces (APM).
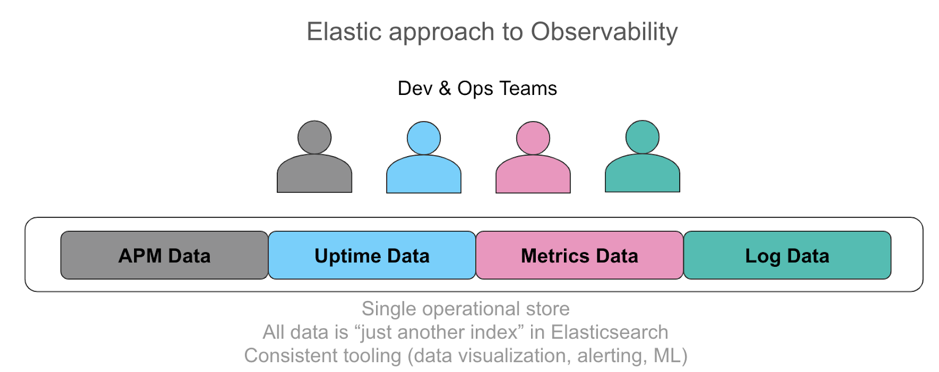
Within Elastic, bringing together these pillars has improved so much, that it has become even more straightforward to get insight into the condition of the organizational environment.
Elastic’s Observability changed from this:
To this:
Bonus takeaway: Masterbeats
Currently, there are separate beats that each collect a part of the data (metricbeat for metrics, filebeat for logs, etc).
However, Elastic On Tour announced, that soon there will be a Masterbeats that collects all applications together. This Masterbeats consolidates the functionality of all beats into a single beat, in order to facilitate configuration, installation, and management.
Full-Stack Monitoring with Devoteam
Is your organization using multiple monitoring tools? Which means no single source of truth. Or are you experiencing challenges in monitoring license costs (multiple tools means multiple licenses)? We at Devoteam believe in helping you with creating a single source of the truth.

